Figures & data
Figure 1 Increased default mode network connectivity in high dream recallers (HR) compared to low dream recallers (LR). (A) Schematic illustration of the four main nodes of the default mode network (DMN) included in the functional connectivity analysis. (B) Mean pairwise connectivity of the DMN for HR (red) and LR (black), obtained by averaging for each subject all the pairwise correlation values within the default network. The average DMN connectivity was significantly higher in HR than in LR. Error bars represent the 95% confidence intervals. *p < 0.05. (C) Left grey panel. Functional connectivity matrix representing the mean pairwise correlation coefficient between regions of the DMN in HR and LR. Right. Between-group statistical comparison (two-sided t-test corrected for multiple comparisons using the false discovery rate). The connectivity between the right lateral parietal and medial prefrontal cortex was significantly higher in HR than in LR.
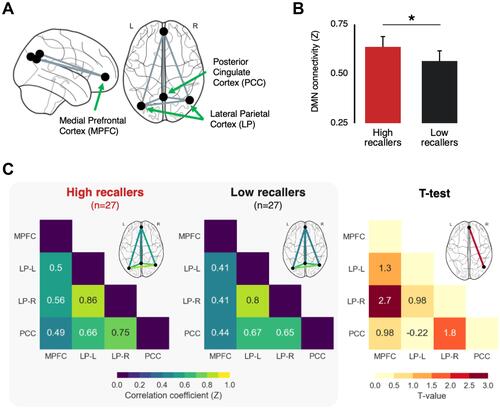
Table 1 Between-Group Differences in Cognitive and Personality Assessments
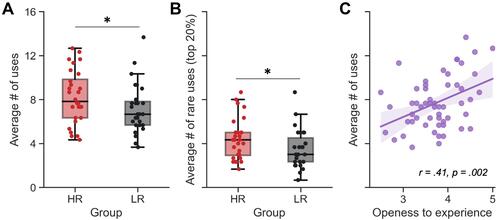
Figure 2 Creativity score in high dream recallers (HR) and low dream recallers (LR). (A) Box plot of the average number of uses per object found by HR (red) and LR (black) during the Guildford’s alternate uses task (also referred to as the fluency index). HR reported significantly more uses than LR. (B) Box plot of the average number of uses reported by 10 or less participants per object (ie top 20%) found by HR (red) and LR (black). HR reported significantly more rare uses than LR. (C) Significant correlation between the fluency index at the Guildford’s task and the openness to experience personality dimension measured using the BFI questionnaire. All plots share the same y-ticks, ranging from 0 to 16. *p<0.05.