Figures & data
Figure 1 Schematic of recruiting procedures for the OSA patients in this study.
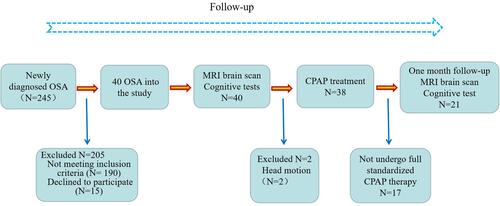
Table 1 Population and Clinical Characteristics of Particpants
Figure 2 The MoCA score were changed between post- and pre-CPAP OSA patients. (A) Each OSA patient changes. (B) The mean value of MoCA.
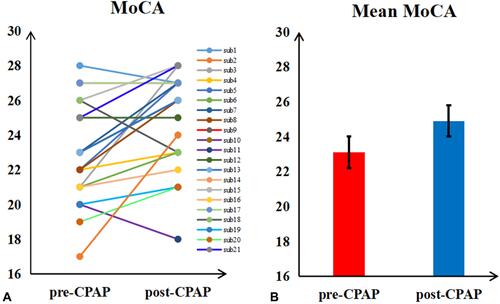
Figure 3 The ESS score were changed between post- and pre-CPAP OSA patients. (A) Each OSA patient changes. (B) The mean value of ESS.
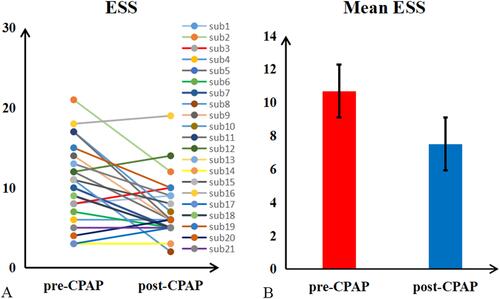
Figure 4 Highly similar spatial distribution patterns of ReHo were found at the group level for healthy controls (A) and OSA patients (pre-CPAP (B) and post-CPAP (C)) in the typical frequency band (0.01–0.1 Hz), slow-4 frequency band (0.027–0.073 Hz), and slow-5 frequency band (0.01–0.027 Hz).
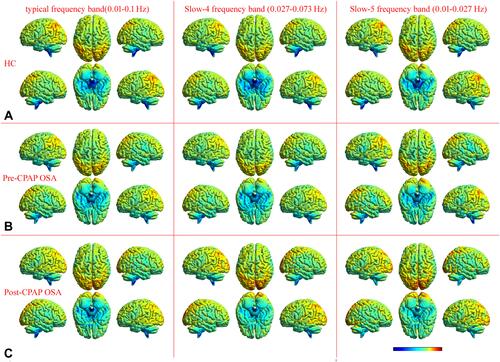
Table 2 Significant Altered ReHo in Typical Frequency Band (0.01–0.1 Hz) Between the Pre-CPAP OSA Patients and HC Groups (Two Sample t-Test)
Figure 5 Two-sample t-test in the typical frequency band (0.01–0.08 Hz) (A). The results were obtained by a 2×2 two-way ANOVA analysis (group: baseline OSA patients and HC; frequency band: slow-4 and slow-5), Main effects of group (B); Main effects of frequency band (C); Interaction between frequency bands and groups (D). The post hoc two-sample t-test for the slow-4 frequency band (0.027–0.073 Hz) (E) and slow-5 frequency band (0.01–0.027 Hz) (F). All results were reported at voxel-level p < 0.01 and cluster-level p < 0.05, GRF corrected.
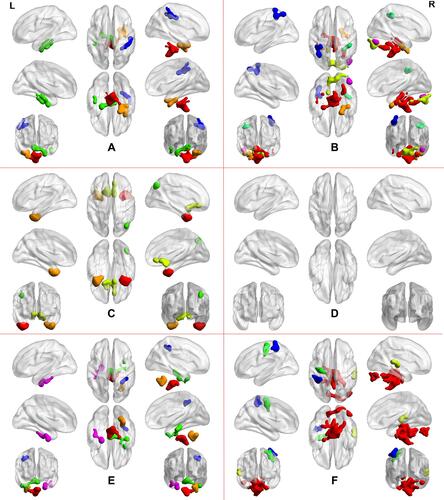
Table 3 Significant Altered ReHo in Main Effect of Group (Pre-CPAP OSA and HC Groups)
Table 4 Significant Altered ReHo at Specific Frequency Bands Between the Pre-CPAP OSA Patients and HCs (Two Sample t-Test)
Table 5 Significant Altered ReHo at Typical Frequency Band (0.01–0.1 Hz) Between the Post-CPAP OSA Patients and Pre-CPAP OSA (Paired Sample t-Test)
Table 6 Significant Altered ReHo at Specific Frequency Bands Between the Post- and Pre-CPAP OSA (Paired Sample t-Test)
Figure 6 Pair sample t-test in the typical frequency band (0.01–0.08 Hz) (A), the slow-4 frequency band (0.027–0.073 Hz) (B), and slow-5 frequency band (0.01–0.027 Hz) (C) between pre- and post-CPAP OAS patients. The CPAP treatment-related changes of the ReHo in the three different frequency bands in OSA patients (D). All results were reported at voxel-level p < 0.01 and cluster-level p < 0.05, GRF corrected.
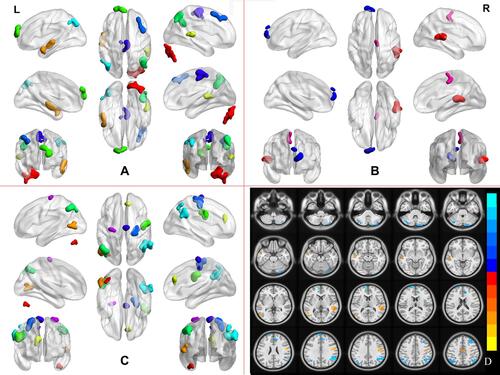
Figure 7 Mean ReHo z-value of HC, pre- and post-CPAP OSA patients in altered brain regions, which were compared before and after CPAP treatment in OSA patients in three different frequency band. (A) typical frequency band; (B) slow-4 band; (C) slow-5 band.
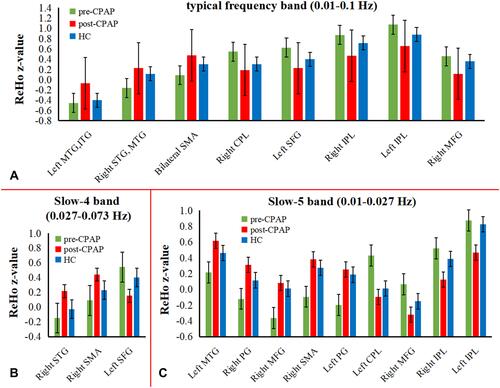
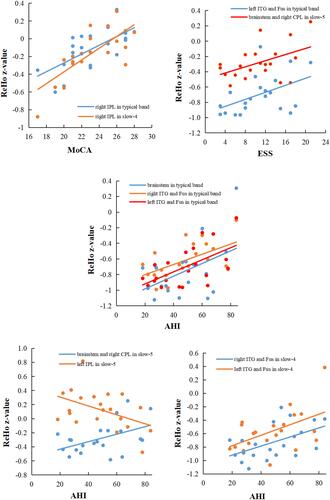
Figure 8 In the pre-CPAP OSA patients, significant correlations between the mean ReHo z-value with between-subgroup differences (pre-CPAP OSA patients vs HC groups) and clinical assessment.