Figures & data
Table 1 Demographic Characteristics of the Current Sample (N=1240)
Table 2 Mean, Standard Deviation, Skewness, and Kurtosis for the SIQ Items (N=1240)
Figure 1 Network structure of the sleep inertia symptoms in the total sample (N= 1240). Blue lines indicate positive associations, and orange lines indicate negative associations. The thickness of an edge represents the association strength, the size of a circle represents the node strength, and the area of red ring indicates the predictability.
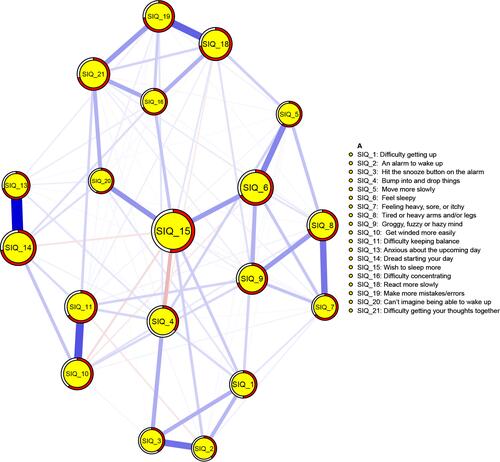
Figure 2 Centrality indices of network structure of sleep inertia symptoms, shown as standardized values z-scores.
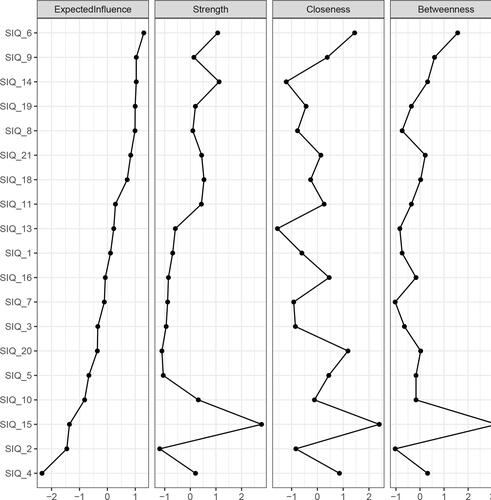
Figure 3 Stability of centrality indices as assessed using the case-dropping bootstrap method. The x-axis represents the percentage of cases of the original sample used at each step. The y-axis represents the average of correlations between the centrality indices from the original network and the centrality indices from the networks that were re-estimated after excluding increasing percentages of cases. Each line indicates the correlations among betweenness, closeness, and strength, while areas indicate 95% CI.
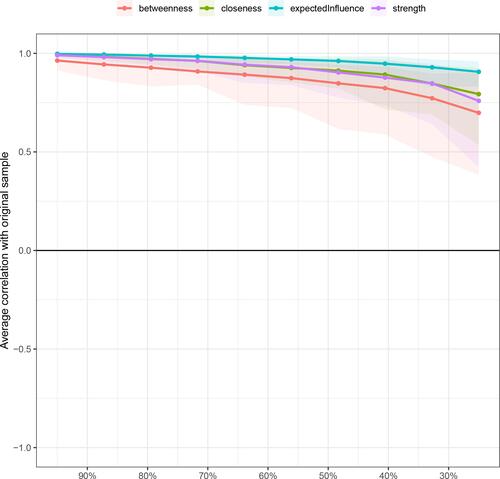
Figure 4 Estimation of node strength difference by bootstrapped difference test. Bootstrapped difference tests between node strength of factors. Gray boxes indicate nodes that do not significantly differ from one-another. Black boxes represent nodes that differ significantly from one another (α = 0.05). White boxes show the values of node strength.
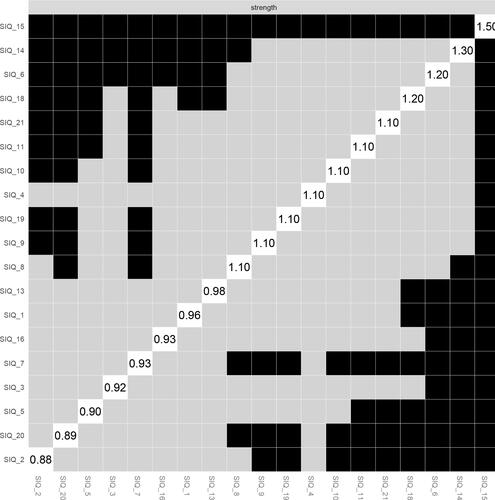
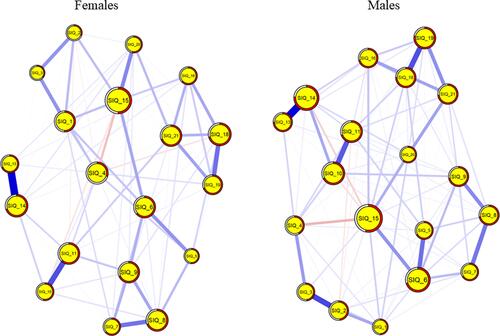
Figure 5 Estimated network models for sleep inertia symptoms between females and males. Left panel: network structure in females (n = 675); right panel: network structure in males (n = 565).