Figures & data
Figure 1 Homeostatic sleep propensity (sleep load) increases through the waking day and is dissipated by sleep.
Reproduced from Physiology and Behaviour; 90, Beersma DGM and Gordijn MCM, Circadian Control of the Sleep-Wake Cycle 190–195, Copyright (2007), with permission from Elsevier.Citation221
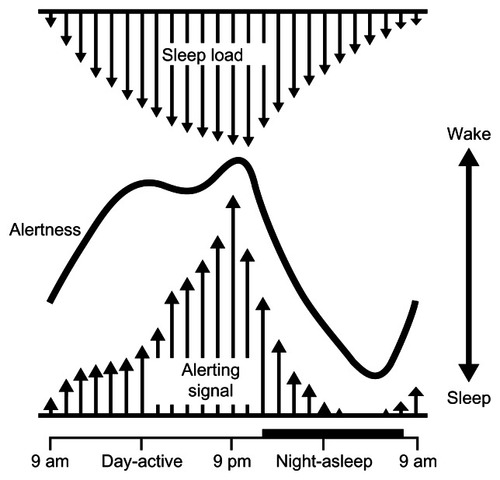
Figure 2 Representative actograms from healthy control (A and E), mildly demented (B and F) and moderately demented (C, G, D and H) subjects recorded first in year 1 (A ± D), and for the same subjects at follow-up in year 2 (E ± H).
From Hatfield CF et al. Disrupted daily activity/rest cycles in relation to daily cortisol rhythms of home-dwelling patients with early Alzheimer’s dementia, Brain, 2004, 27, part 5,1061–74, by permission of Oxford University Press.Citation178
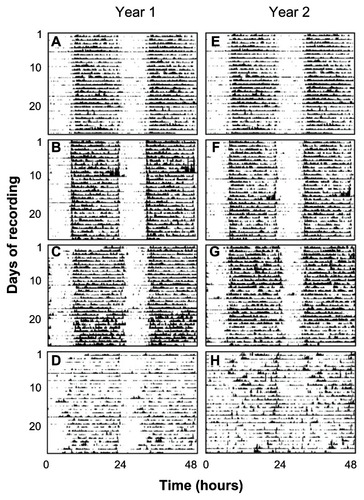
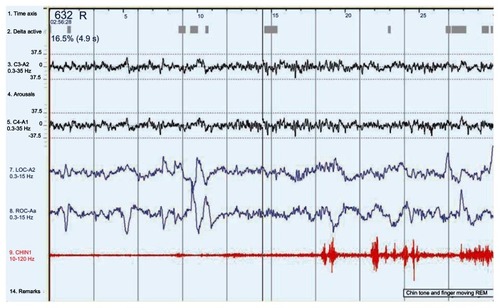
Figure 3 A 30-second epoch from a polysomnograph demonstrating the changes in REM behavior disorder.
Abbreviations: LOC, left outer canthus of the eye; REM, rapid eye movement; ROC, right outer canthus of the eye.