Figures & data
Table 1 Clinical Characteristics of Patients with Pure-OSA and Mixed-OSA
Table 2 Sleep Characteristics of OSA Patients with Pure-OSA and Mixed-OSA
Table 3 Multivariate Logistic Regression Analysis of Factors Associated with Mixed-OSA
Table 4 Cut-off Value of AHI for Predicting Mixed-OSA with Different MAI Criteria
Table 5 Cut-off Value of LSO2 for Predicting Mixed-OSA with Different MAI Criteria
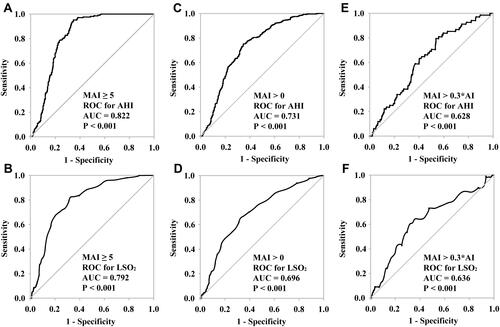
Figure 1 ROC curves of the cut-off value for AHI and LSO2 to predict mixed-OSA. (A, C, E) ROC curves of the cut-off values for AHI to predict mixed-OSA with different criteria to define mixed-OSA, which were MAI ≥ 5 (A), MAI > 0 (C), and MAI > 30% AI (E), respectively. (B, D, F) ROC curves of the cut-off values for LSO2 to predict mixed-OSA with different criteria to define mixed-OSA, which were MAI ≥ 5 (B), MAI > 0 (D), and MAI > 30% AI (F), respectively.