
Figures & data
Table 1 Demographic and Clinical Characteristics of All the Participants
Table 2 Polysomnographic Characteristics of All the Participants
Table 3 Comparison of Relative Spectral Power and Frequency Band Ratios Between OSA and Control Groups
Figure 1 Comparisons of the relative spectral power during NREM sleep, REM sleep and total sleep between OSA patients and controls. *p < 0.05. Bars denote mean ± standard deviation.
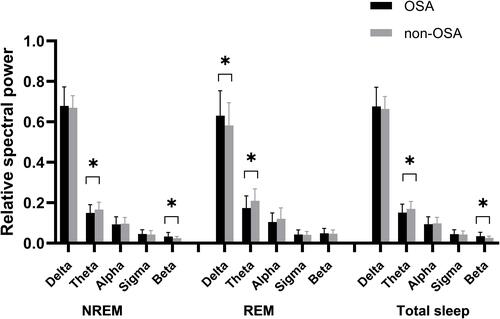
Figure 2 Comparisons of the frequency band ratios (TAR and TBR) during NREM sleep, REM sleep and total sleep between OSA patients and controls. *p< 0.05. Bars denote mean ± standard deviation.
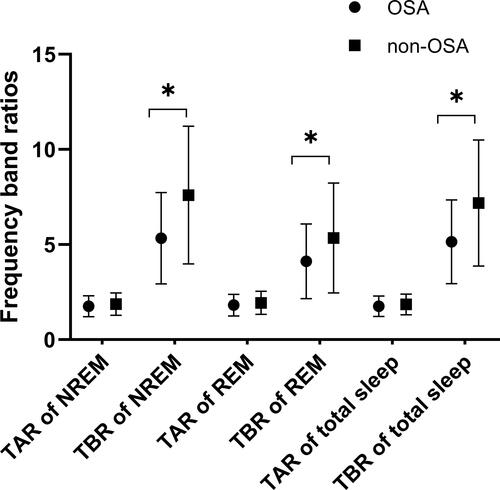
Table 4 Correlation Analyses Between AHI, Relative Spectral Power and Frequency Band Ratios of All the Participants
Table 5 Correlation Between Arousal Index, Relative Spectral Power and Frequency Band Ratios of All the Participants