Figures & data
Table 1 Demographic and Clinical Characteristics of Participants
Table 2 Comparison of Local Gyrification Index Between Patients with Generalized Anxiety Disorder and Healthy Controls
Figure 1 Local gyrification index (LGI) comparison in the left hemisphere. (A) Patients with GAD displayed hypogyrification in the insula, orbitofrontal cortex (OFC), middle frontal gyrus (MFG), temporal pole, and fusiform area. (B) A negative relationship between the LGI of the OFC, insula, MFG, and insomnia was found.
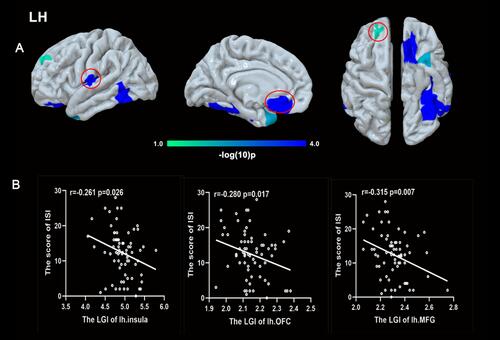
Figure 2 Local gyrification index (LGI) comparison in the right hemisphere. Patients with GAD displayed hypogyrification in the insula and orbitofrontal cortex (OFC). A negative relationship was found between the LGI of the OFC and insomnia.
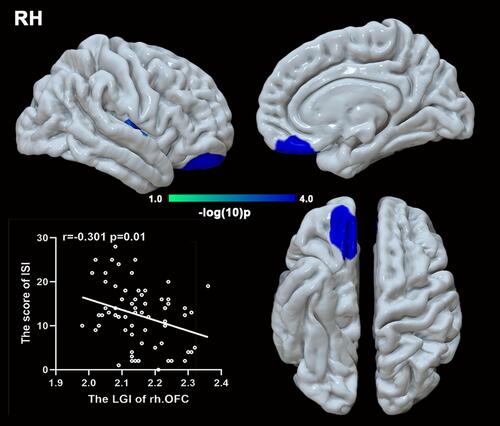
Figure 3 Cortical thickness (CT) and surface area (SA) in GAD patients compared with controls in the region with LGI reduction in GAD. CT in the right orbitofrontal cortex (OFC) was increased whereas SA was reduced in the left OFC.
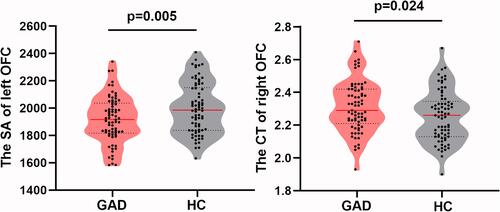
Table 3 Regions Showing Significant Differences in Seed-Based Functional Connectivity Analysis
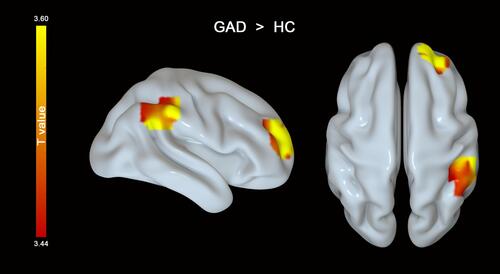
Figure 4 Patients with GAD displayed stronger functional connectivity between the left insula and the right superior frontal cortex and inferior parietal lobe than healthy controls.