Figures & data
Table 1 Participant Demographics and Lung Function
Table 2 Sleep Characteristics
Figure 1 Changes in leg fluid volumes (ΔLFV) and thoracic fluid volumes (ΔTFV) in the OSA group (black lines) and non-OSA group (grey lines) ((A and B), respectively) from pre-sleep to post-sleep measurements. Each line represents an individual participant. P values for comparisons between groups are based on analysis of covariance, adjusted for age, BMI and sex. Bars on either side of data lines represent group mean value with SD.
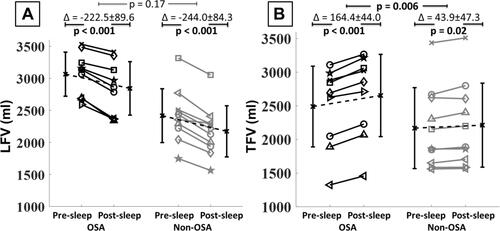
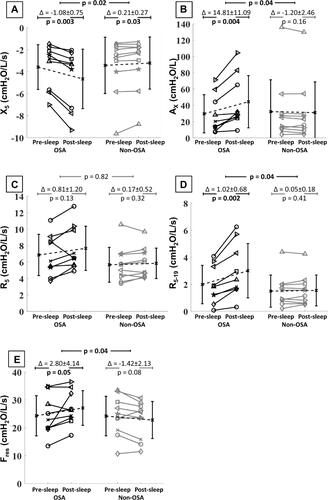
Figure 2 Changes in respiratory system reactance at 5 Hz (X5), reactance area (AX), total respiratory system resistance at 5 Hz (R5), frequency dependence of resistance (R5-19), and resonant frequency (Fres) in the OSA group (black lines) and non-OSA group (grey lines) (A–E, respectively) from pre-sleep to post-sleep measurements. Each line represents an individual participant. P values for comparisons between groups are based on analysis of covariance, adjusted for age, BMI and sex. Bars on either side of data lines represent group mean value with SD. More negative X5 indicates greater small airways resistance.