Figures & data
Figure 1 Illustration of a representative actigraphic nighttime period. Standard parameters of the sleep wake-cycle (eg, wake-up and sleep onset times, duration of sleep and wake episodes) were assessed for the overall nighttime period. Wake episode frequency, duration, distribution, and localization were computed by halves of the nighttime period.
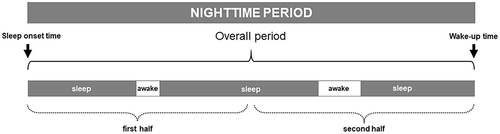
Table 1 Background Characteristics of Study Participants
Table 2 Sleep-Wake Cycle Parameters By Groups
Table 3 Cluster of White Matter Tracts With Lower Fractional Anisotropy Values in the Long Versus Reference Sleep Groups
Table 4 Clusters of White Matter Tracts With Higher Radial Diffusivity Values in the Long Versus Reference Sleep Groups
Figure 2 Fractional anisotropy differences between the Long and Reference sleep groups. The red-yellow color indicates the white matter clusters that showed lower fractional anisotropy values (α < 0.05, threshold-free cluster enhancement and family-wise error correction) in the Long sleep group compared with the Reference sleep group (at the indicated coordinates). The mean skeleton of fractional anisotropy is shown in green. The white matter tracts include the superior Corona radiata and the body of the corpus callosum. The coordinates are presented in Montreal Neurological Institute (MNI) template space.
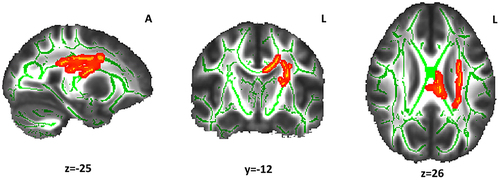
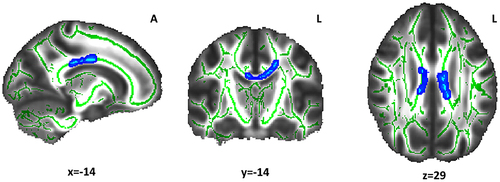
Figure 3 Radial diffusivity differences between the Long and Reference sleep groups. The light-blue color indicates the white matter clusters that showed higher radial diffusivity values (α ≤ 0.05, threshold-free cluster enhancement and family-wise error correction) in the Long sleep group compared with the Reference sleep group (at the indicated coordinates). The mean skeleton of FA is shown in green. The white matter tract includes the body of corpus callosum. Coordinates are presented in Montreal Neurological Institute (MNI) template space.