Figures & data
Figure 1 Experiment protocols. (A and B) Two 8-day protocols in Experiment 1 were designed for non-shift workers, including (A) a circadian alignment protocol with nighttime sleep and (B) a misalignment protocol with nighttime sleep from Day 1 to Day 3, an afternoon nap on Day 4, and daytime sleep from Day 5 to Day 8. (C and D) Two 3-day protocols in Experiment 2 were designed for chronic shift workers, including (C) a circadian alignment protocol with nighttime sleep and (D) a misalignment protocol with an afternoon nap on Day 1 followed by nighttime sleep on Days 2–3.
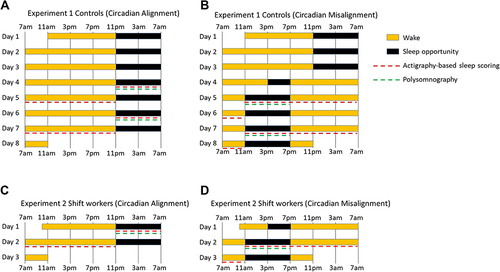
Table 1 Participant Characteristics and Data Analyzed
Figure 2 (A) Sensitivity, (B) specificity, and (C) F1 score comparison of actigraphy-based sleep scoring algorithms for scheduled sleep episodes. Each circle represents the value from an individual study protocol of a participant. The horizontal lines represent the mean and 1 standard deviation above/below the mean. *Indicates p<0.05.
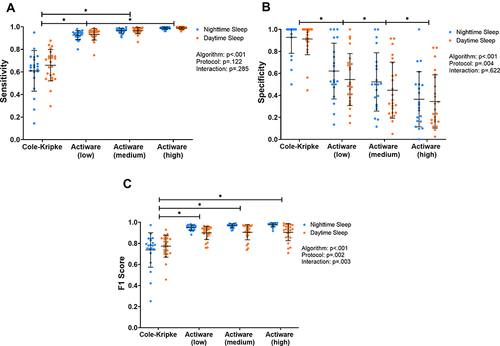
Figure 3 Comparison of sensitivity of actigraphy-based sleep scoring algorithms in detecting sleep during (A) light sleep (ie, N1 and N2), (B) slow-wave sleep (N3), and (C) REM sleep stages. Each circle represents the value from an individual study protocol of a participant. The horizontal lines represent the mean and 1 standard deviation above/below the mean. *p<0.05. *Indicates p<0.05.
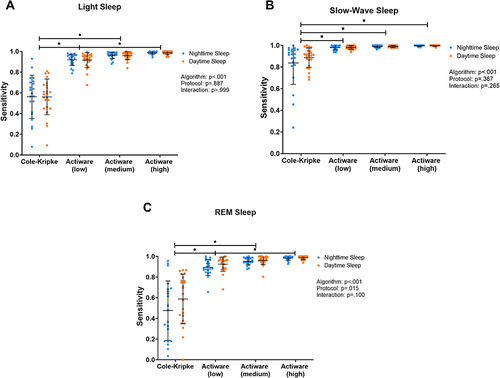
Figure 4 (A) Specificity and (B) F1 score comparison of actigraphy-based sleep scoring algorithms using data during scheduled sleep episodes and using 24-h data. Each circle represents the value from an individual study Protocol of a participant. The horizontal lines represent the mean and 1 standard deviation above/below the mean. *Indicates p<0.05.
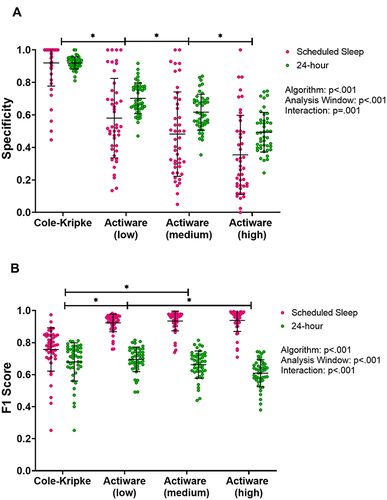
Table 2 Agreement Between the Cole-Kripke Algorithm, Actiware, and PSG on Total Sleep Time (TST)
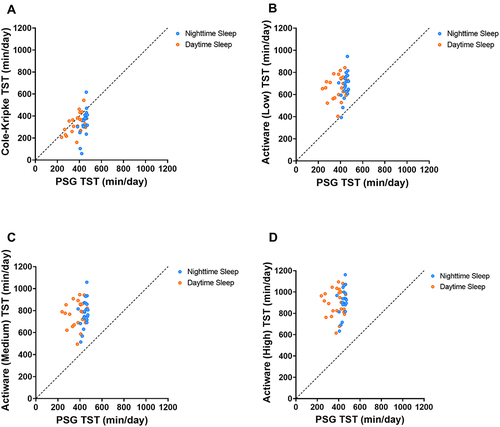
Figure 5 Agreement in total sleep time during scheduled sleep episodes between PSG- and (A) Cole-Kripke algorithm, (B) Actiware with low threshold, (C) Actiware with medium threshold, and (D) Actiware with high threshold. The dashed lines represent perfect agreement.
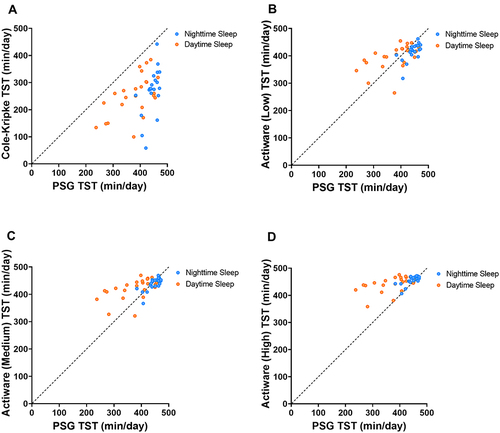
Figure 6 Agreement in total sleep time during 24-hour periods between PSG- and (A) Cole-Kripke algorithm, (B) Actiware with low threshold, (C) Actiware with medium threshold, and (D) Actiware with high threshold. The dashed lines represent perfect agreement.