Figures & data
Figure 1 Flowchart of the study design.
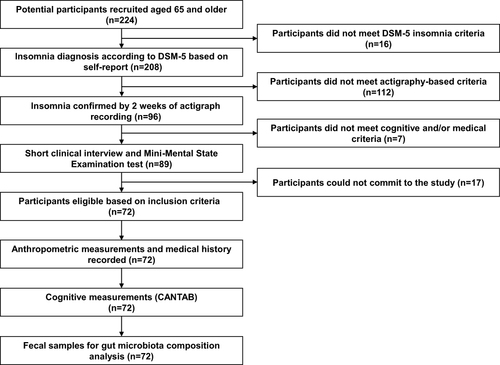
Table 1 Demographic Description
Table 2 Sleep Measurements
Table 3 Cognitive Measurements
Figure 2 Variation in cognitive performance in 67 older adults with insomnia. Principal components analysis (PCA) of scores measured for 15 cognitive tasks. The first two PCs with the highest eigenvalues are presented, together explaining 91.4% of the variance. Colored arrows indicate cognitive measurements with the highest loading on the first and second PC.
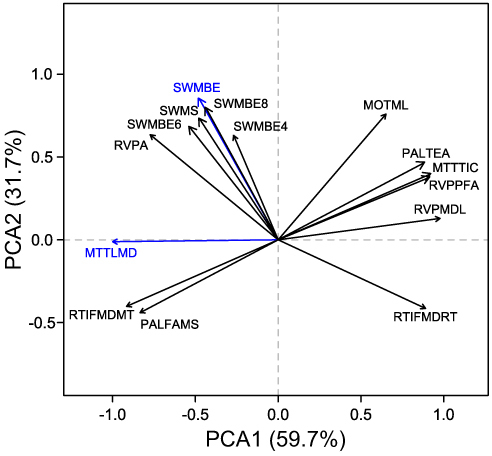
Figure 3 Composition of the gut microbiota of older adults with insomnia. Gut microbiota composition was determined by high-throughput sequencing of 16SrRNA gene fragments, PCR amplified from total DNA extracted from fecal samples. (a) Averages of the phyla relative abundances. (b) The density plot represents the distribution of Firmicutes-Bacteroidetes ratio in insomnia patients. The dotted line marks the median value of ratios.
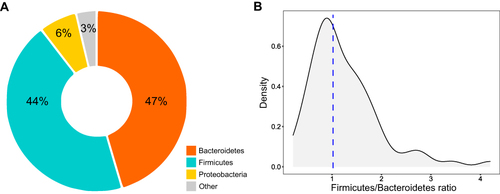
Table 4 The Contribution of Insomnia and Cognitive Parameters to the Variance in Gut Microbiota Composition
Figure 4 Partial canonical correspondence (pCCA) ordination plot. The first and third canonical correspondence axes are shown. Values in brackets represent the percentage of total variance explained by the axis. Each dot represents a sample; colors are assigned according to ISI categories (ISI_cat) (1=0–7, absence of insomnia; 2=8–14, sub-threshold insomnia; 3=15–21, moderate insomnia; 4=22–28, severe insomnia).
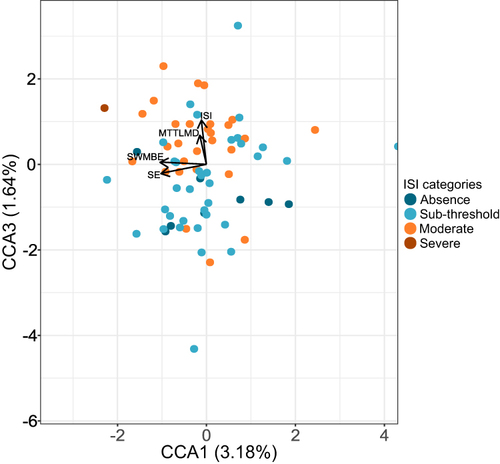
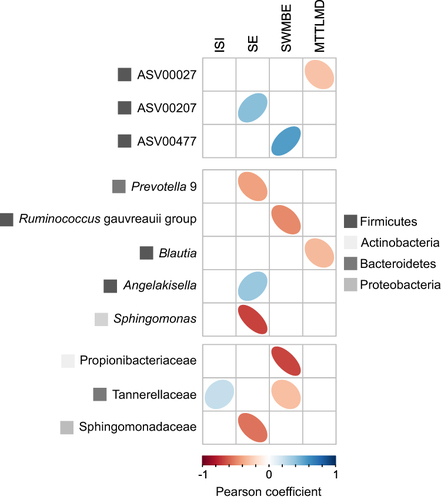
Figure 5 Pearson correlations between ASVs or taxonomic groups most associated with the canonical correspondence axis (three top ASVs/taxa for each of the four CCAs) and insomnia and cognitive measurements. ASVs/taxa for which P-values <0.05 are presented for ASV and family levels of classification; taxa for which FDR ajusted P-value <0.1 are presented for the genus level of classification.