
Figures & data
Figure 1 HRV circadian rhythm analysis. Definition of circadian rhythm parameters (A). The 1440 or 288 data points (black dots) extracted from 1-min (SDNN, RMSSD) or 5-min (LF, HF, LF/HF ratio, and LFnu) epochs of 24-hour ECG signals. The red lines are the circadian rhythm fitting curves of SDNN (B), RMSSD(C) and LF(D), HF(E), LF/HF ratio(F), LFnu(G), heart rate(H) and SD1(I) from one individual, respectively. MESOR, M, is a rhythm-adjusted mean that reflects the overall average of the HRV index; A, amplitude, the height of the maximum oscillation to the midline, and double amplitude represents the extent of rhythmic fluctuation within a cycle; θ, acrophase, is the timing of the zenith occurring in each cycle (the reference time point 12:00 AM was set as the value of 0). The significance of the cosine periodic rhythm curves was tested, indicated by the P value (All P < 0.0001).
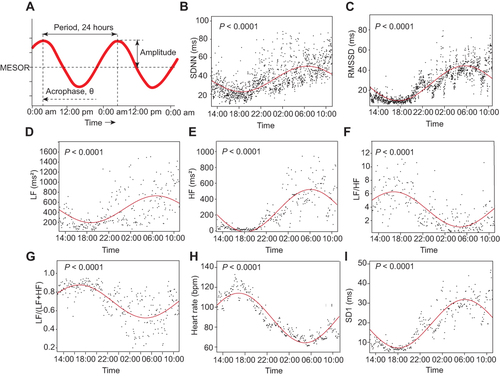
Table 1 The Median (IQR) Values of Selected Characteristics of the Two Female Groups Stratified by Night Shift Work
Table 2 The Comparison of the Three Circadian Pattern Parameters (M, A, θ) for Each HRV Index Between the Two Female Groups Stratified by Night Shift Work
Table 3 Association of the Severities of Mental Stress and the Circadian Pattern Parameters (M, A, θ) of Each HRV Index in Night-Shift Female Workers Based on Linear Regression Modelsa
Table 4 Association of the Severities of Anxiety, Depression and the Circadian Patterns Parameters (M, A, θ) of Each HRV Index in Night-Shift Female Workers Based on a Linear Regression Modela
Table 5 Association of the Severities of Sleepiness, Fatigue, Sleep Quality and the Circadian Patterns Parameters (M, A, θ) of Each HRV Indices in Night-Shift Female Workers Based on a Linear Regression Modela
Table 6 Association of the Number of Sleep Bouts and the Circadian Patterns Parameters (M, A, θ) of Each HRV Index in Night-Shift Female Workers Based on a Linear Regression Model a
Table 7 Combined Effects of Daily Mean LF, HF, LF/HF Ratio on the Circadian Pattern Parameters (M, A, θ) of Each HRV Index in Night-Shift Female Workers Based on a Linear Regression Model b