272
Views
0
CrossRef citations to date
0
Altmetric
ORIGINAL RESEARCH

Association of Dietary Behaviors with Poor Sleep Quality and Increased Risk of Obstructive Sleep Apnea in Korean Military Service Members

ORCID Icon, , , , , ORCID Icon, ORCID Icon, ORCID Icon & ORCID Icon show all
Pages 1737-1751 | Received 14 Jun 2022, Accepted 13 Sep 2022, Published online: 25 Sep 2022

Figures & data

Table 1 Characteristics of Military Service Members

Figure 1 Distribution of global Pittsburgh sleep quality index (PSQI) scores.

Figure 1 Distribution of global Pittsburgh sleep quality index (PSQI) scores.

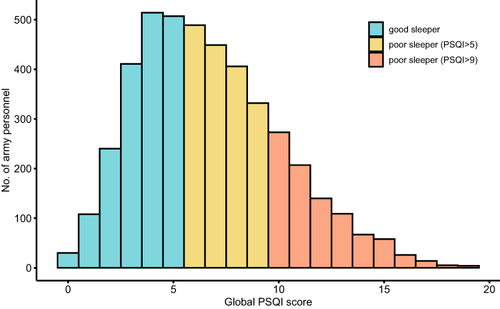
Table 2 Multivariable Logistic Regression of Dietary Behaviors for Poor Sleep Quality (PSQI > 5)

Table 3 Multivariable Logistic Regression of Dietary Behaviors for Poor Sleep Quality (PSQI > 9)

Figure 2 Forest plot of the odds ratios of dietary behaviors on poor sleep quality. Adjusted odds ratios and 95% confidence intervals (CI) were calculated in the multivariable logistic model using demographic, lifestyle, and occupational factors as the covariates. The size of the square represents the number of participants in each item.

Figure 2 Forest plot of the odds ratios of dietary behaviors on poor sleep quality. Adjusted odds ratios and 95% confidence intervals (CI) were calculated in the multivariable logistic model using demographic, lifestyle, and occupational factors as the covariates. The size of the square represents the number of participants in each item.

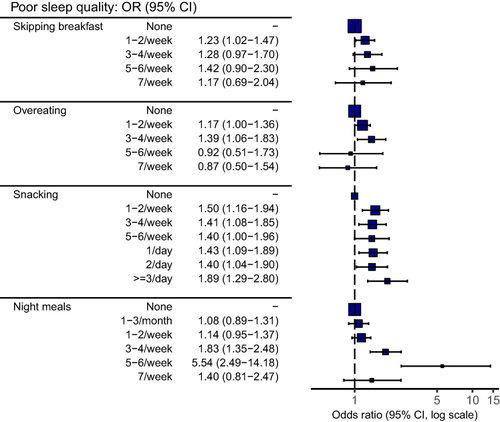
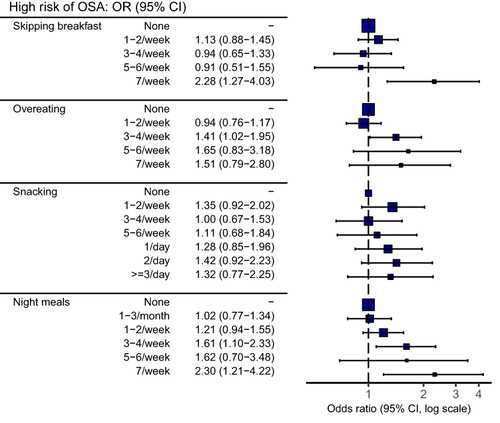
Table 4 Multivariable Logistic Regression of Dietary Behaviors for High Risk of OSA

Figure 3 Forest plot of the odds ratios of dietary behaviors on high risk of obstructive sleep apnea (OSA). Adjusted odds ratios and 95% confidence interval (CI) were calculated in the multivariable logistic model using demographic, lifestyle, and occupational factors as the covariates. The size of the square represents the number of participants in each item.

Figure 3 Forest plot of the odds ratios of dietary behaviors on high risk of obstructive sleep apnea (OSA). Adjusted odds ratios and 95% confidence interval (CI) were calculated in the multivariable logistic model using demographic, lifestyle, and occupational factors as the covariates. The size of the square represents the number of participants in each item.