Figures & data
Figure 1 (A) Peripapillary scan in the superficial layer. (B) The resulting images of peripapillary scan in superficial layer after AngioTool analysis. (C) Macular scan in the superficial layer. (D) The resulting images of macular scan in superficial layer after AngioTool analysis.
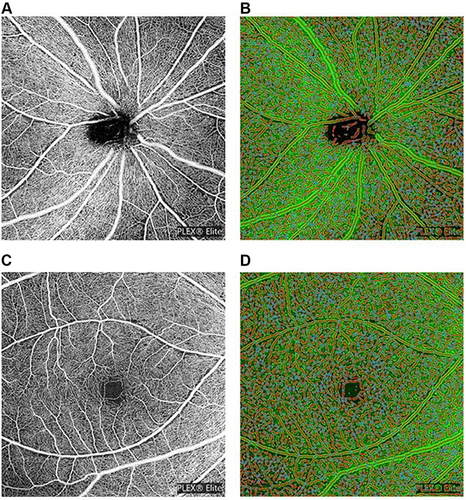
Table 1 Demographic Data of All Participants Grouped According to the Apnea/Hypopnea Index (AHI, /hr.)
Table 2 Ophthalmologic Examination Data of All Participants Grouped According to the Apnea/Hypopnea Index (AHI, /hr)
Table 3 Comparison of Polysomnographic Data Between Normal/Mild OSA (AHI < 15; N = 75) and Moderate/Severe OSA Patients (AHI ≥ 15; N = 95)
Table 4 Comparison of Ophthalmologic Examinations Between Normal/Mild OSA (AHI < 15; N = 75) and Moderate/Severe OSA Patients (AHI ≥ 15; N = 95)
Figure 2 (A) peripapillary vascular densities, superficial layer. (B) peripapillary vascular densities, choroidal layer. (C) macular vascular densities, superficial layer. (D) macular vascular densities, choroidal layer.
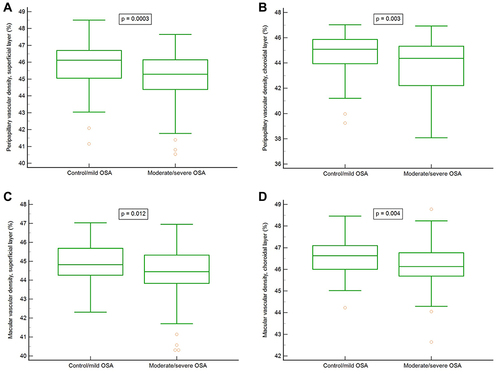
Table 5 Rank Correlation (ρ) Between Polysomnographic Variables and Ophthalmologic Variables in All Participants
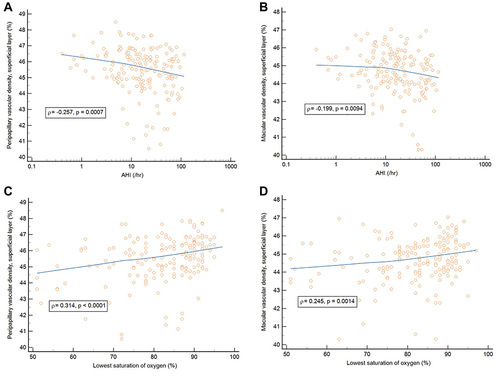
Figure 3 (A) Correlation between peripapillary vascular density in the superficial layer and AHI. (B) Correlation between macular vascular density in the superficial layer and AHI. (C) Correlation between peripapillary vascular density in the superficial layer and LSaO2. (D) Correlation between macular vascular density in the superficial layer and LSaO2.