
Figures & data
Figure 1 Flowchart summarizing the study procedure.
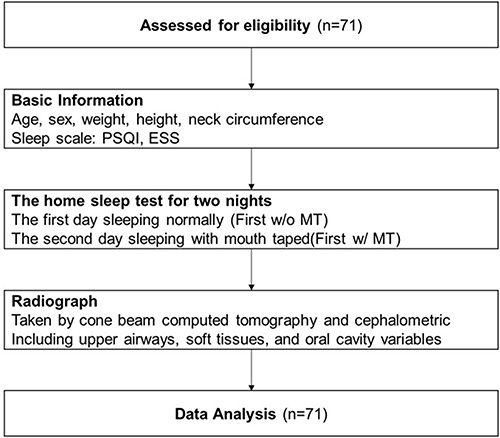
Figure 2 Images to demonstrate how the participants slept with their mouths sealed by the breathable tape throughout the night.
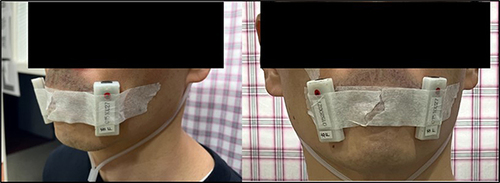
Figure 3 Measurements of the upper airway variables in CBCT images: transverse dimension variables of oral cavity variables in CBCT images.
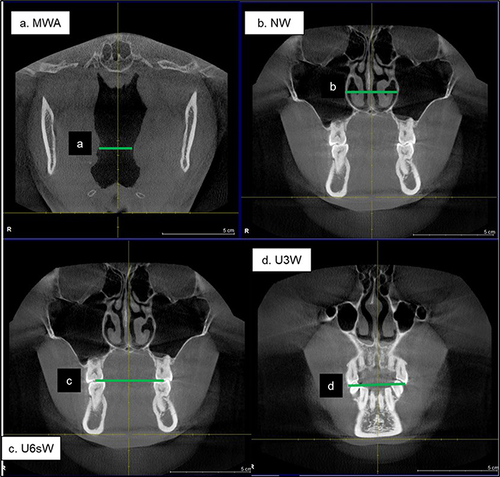
Figure 4 Sagittal and vertical dimension variables of the upper airway, soft tissue, and oral cavity in cephalometric images.
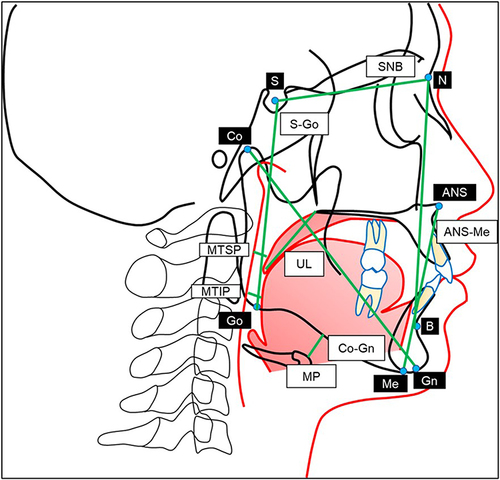
Table 1 Compare the ODI Improved Group and the ODI Not-Improved Group After Mouth-Taped
Table 2 Correlation Between the SpO2-Related Variables and MPS Variables of Participants When Not Mouth-Taped
Table 3 The Data from All the Participants are Categorized into Four MPSs to Assess the Difference in SpO2-Related Variables by Minutes
Table 4 Correlation Between the SpO2-Related Variables and Basic Information/Upper Airway/Stomatognathic Structure Variables