Figures & data
Figure 1 Schematic of the 12-day, 11-night, laboratory study protocol. After an adaptation night (A), subjects underwent 3 iterations (numbered dotted boxes) of a 12 h waking period (W), a baseline night (B), a 36 h period of total sleep deprivation (SD), and a recovery night (R), which was followed by a final 12 h waking period and a final predeparture recovery night (P). All eight sleep opportunities (gray) were PSG-recorded and involved 12 h time in bed (22:00–10:00). Tick marks are at 12 h intervals; extended tick marks indicate midnight. Figure adapted from Tucker et al (2007).
Table 1 Sleep Stage Transitions and Sleep Cycle Characteristics at Baseline and During Recovery Sleep After 36 h of Total Sleep Deprivation, Interindividual Variabilities, Between- and Within-Subjects Variance Components, and Intraclass Correlation Coefficients, for 17 Healthy Young Adults
Figure 2 Magnitude of the phenotypic interindividual differences versus that of the response to 36 h of total sleep deprivation for sleep stage transition and sleep cycles variables with significant sleep deprivation effects. The gray bars indicate the group-average effect of sleep deprivation (ie, the absolute difference between recovery sleep and baseline sleep). The black bars indicate the span of systematic interindividual differences across the eight nights (ie, 95% reference interval of between-subjects variability). Error bars represent standard errors.
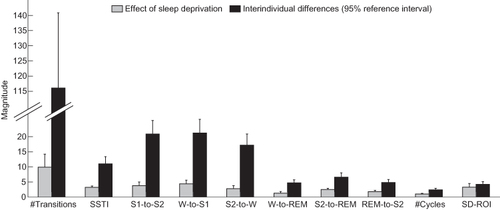
Figure 3 Distribution of NREM transition balance index, TBIS2. Frequencies are shown for pooled dataset (8 recorded nights for 17 subjects each = 136 records). Positive values indicate greater tendency to transition from S2 to SWS than to W or S1; negative values indicate the opposite; and a value of zero indicates balance between these transitions. The black dashed line denotes a normal distribution with mean of zero.
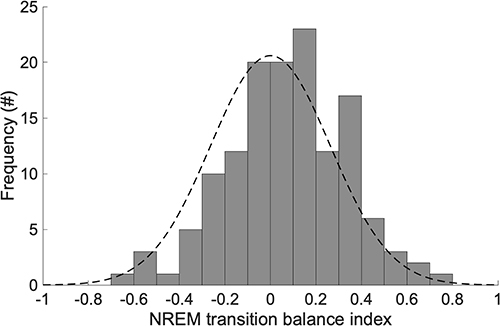
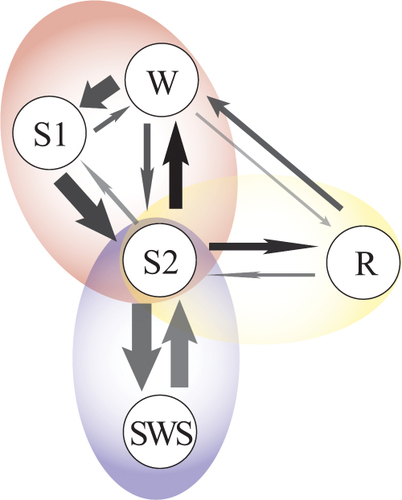
Figure 4 Transition diagram illustrating the three posited underlying subsystems with major patterns of transition between sleep stages. Arrows indicate the direction of transitions; the thickness of the arrows indicates their overall number, and the darkness (from light gray to black) the degree of interindividual variability (ie, the ICC). Note that transitions between wake and REM are regarded as separate from the three subsystems centered on S2 because those transitions are mostly contained within REM episodes (REM-to-W-to-REM).