Figures & data

Figure 1 Participant disposition. The bolded text indicates the number and percentage of eligible participants who completed the survey and were analyzed.
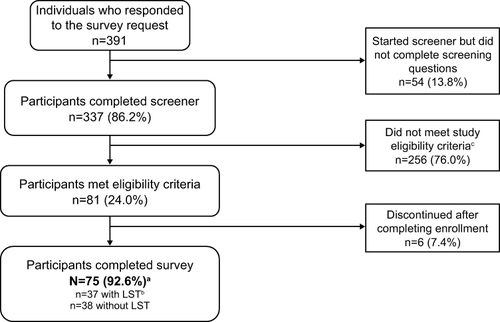
Table 1 Demographics and Participant Characteristics
Figure 2 FOSQ-10 scores. The bottom and top edges of the box indicate the first and third quartiles, the line inside the box is the median, and the marker inside the box is the mean. The whiskers extending from the box indicate the minimum and maximum values.
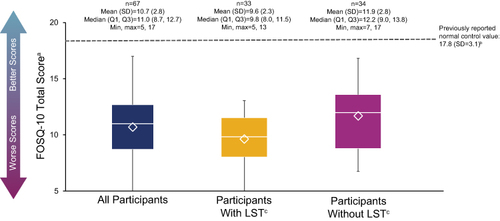
Figure 3 Neuro-QoL short form scores in Social Rolesa (A) and Stigmab (B) domains. The bottom and top edges of the box indicate the first and third quartiles, the line inside the box is the median, and the marker inside the box is the mean. The whiskers extending from the box indicate the minimum and maximum values.
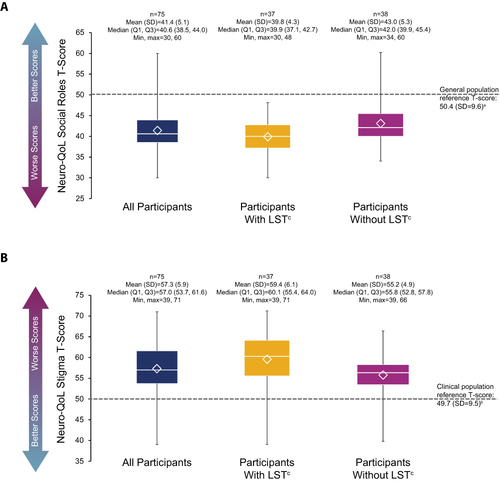
Table 2 BC-CCI and PHQ-9 Scores
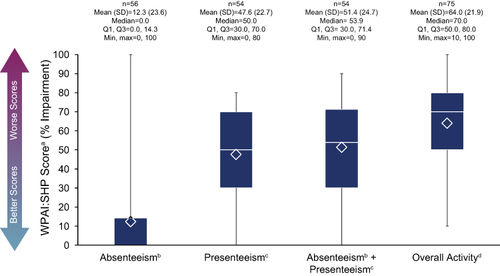
Figure 4 WPAI:SHP scoresa in all participants. The bottom and top edges of the box indicate the first and third quartiles, the line inside the box is the median, and the marker inside the box is the mean. The whiskers extending from the box indicate the minimum and maximum values.