Figures & data
Table 1 Demographics of the Participants and Neuropsychological Evaluations of Three Group Patients
Table 2 Demographics of the Participants and Neuropsychological Evaluations of the CI-Mild OSA Patients and CI- Moderate-to-Severe OSA Patients
Table 3 Objective and Subjective Sleep Characteristics of the Three Groups Patient
Table 4 Objective and Subjective Sleep Characteristics of the CI-Mild OSA Patients and CI- Moderate-to-Severe OSA Patients
Table 5 Autonomic Nervous Function of the Three Groups Patients
Table 6 Autonomic Nervous Function of the CI-Mild OSA Patients and CI- Moderate-to-Severe OSA Patients
Figure 1 Correlation between autonomic nervous function and severity of depressive and anxiety in the CI-OSA group. The MMSE scores showed a negative correlation HAMD scores (r=−0.678, p < 0.01) (A). The HAMD and HAMA scores showed a positive correlation with LF ratio (r=0.321, p =0.031; r =0.449, p =0.002) (B and C) and a negative correlation with HF ratio (r=−0.321, p =0.031; r =−0.449, p =0.002) (D and E). And the HAMA scores showed a positive correlation with LF/HF ratio (r=0.434, P =0.003) (F).
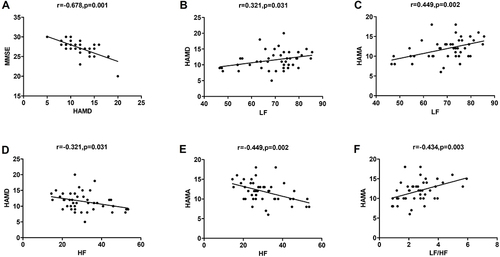
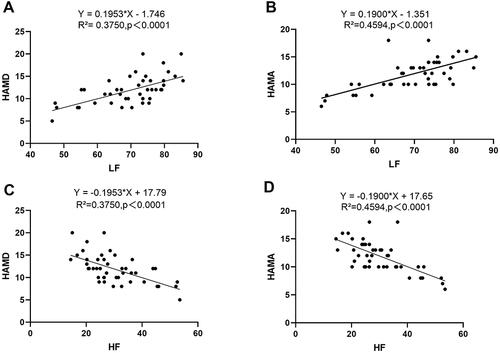
Figure 2 Linear regression of autonomic nervous function and severity of depressive and anxiety in the CI-OSA group. (A and C) Increased LF ratio and decreased HF ratio in the CI-OSA patients were independently associated with HAMD scores (R²=0.3750, p<0.0001); (B and D) Increased LF ratio and decreased HF ratio in the CI-OSA patients were independently associated with HAMA scores (R²=0.4594, p<0.0001).