Figures & data
Figure 1 The overview and assumptions of the MR study design. Assumption 1: the instrumental variables that refer to genetic variation have a strong relationship with exposure (OSA). Assumption 2: the used IVs are not linked with potential confounders. Assumption 3: the genetic variants are related to the outcome only through selected exposure (OSA), not via alternative pathways.
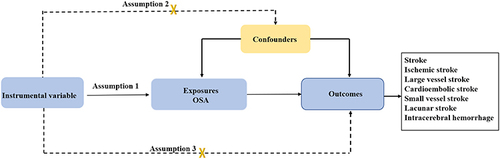
Table 1 Details of the GWAS Databases Included in the Mendelian Randomization
Table 2 Characteristics of Instrumental Variables Associated with Obstructive Sleep Apnea
Table 3 MR Analyses Effect Estimates for Associations Between Obstructive Sleep Apnea and Stroke
Figure 2 Scatter plots of genetic associations between OSA and stroke or subtypes. (A) Stroke; (B) ischemic stroke; (C) large vessel stroke; (D) cardioembolic stroke; (E) small vessel stroke; (F) lacunar stroke. The slope of the straight line indicates the magnitude of the causal association.
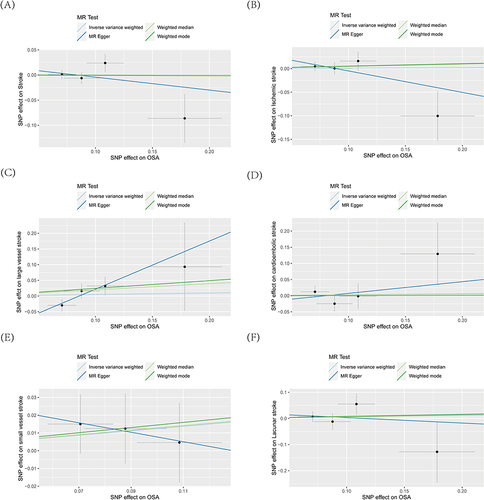
Figure 3 Forest plot of genetic associations between OSA and stroke or subtypes. (A) Stroke; (B) ischemic stroke; (C) large vessel stroke; (D) cardioembolic stroke; (E) small vessel stroke; (F) lacunar stroke.
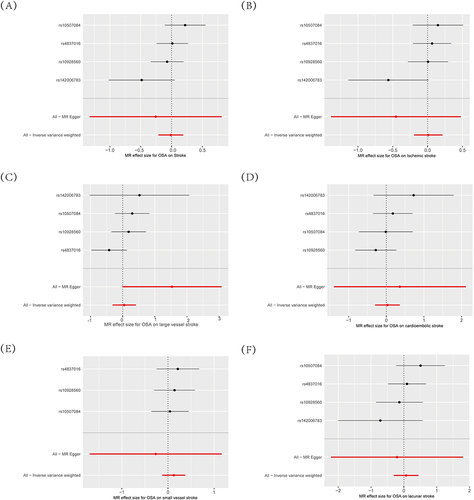
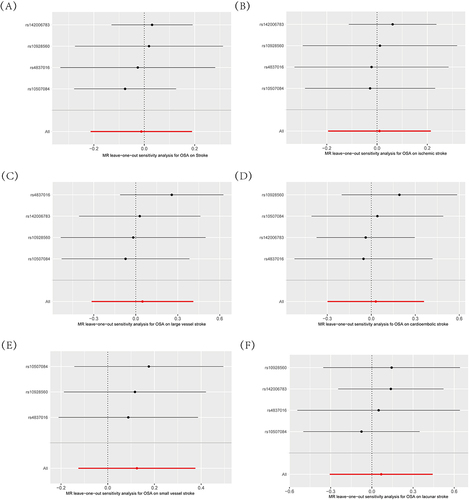
Figure 4 The leave-one-out-sensitivity forest plot of genetic associations between OSA and stroke or subtypes. (A) Stroke; (B) ischemic stroke; (C) large vessel stroke; (D) cardioembolic stroke; (E) small vessel stroke; (F) lacunar stroke. The bars indicate the CI.