Figures & data
Figure 1 Facial landmarks in frontal and profile views.
Note: (L) = left side of the participants, (R) = right side of the participants.
Abbreviations: Cl, calibration point (L); Cr, calibration point (R); Ns, nasion; Enl, endocanthion (L); Enr, endocanthion (R); Exl, exocanthion (L); Exr, exocanthion (R); T, tragion; Tl, tragion (L); Tr, tragion (R); Prn, prenasale, Sn, subnasion; Anl, ala nasi (L); Anr, ala nasi (R); Las, labrale superior; Lai, labrale inferior; Lal, labrale (L); Lar, labrale (R); Sto, stomion; Ul, upper lip protrusion; Ll, upper lip protrusion; Sl, sublabiale; Pog, pogonion; Me, mentum; Go, gonion; Stl, face point on stomion plane (L); Str, face point on stomion plane (R).
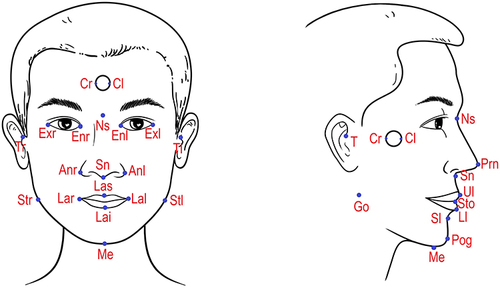
Table 1 Demographic and Respiratory Parameters Between the Participants
Table 2 Comparison of the Score of OSA-18 and Pharyngeal Examination Between Groups
Table 3 Craniofacial Photogrammetry - Primary Analysis
Table 4 The Logistic Regression Model for Predicting Children with Obstructive Sleep Apnea
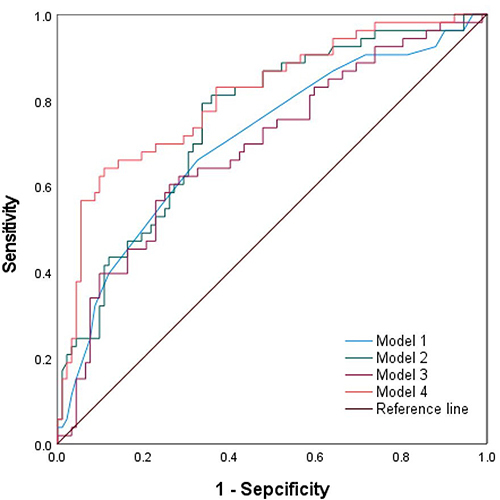
Figure 2 ROC curves for predictive model.
Notes: Model 1: OSA-18 questionnaire (Item 1–4); Model 2: BMI (z score), tonsil hypertrophy, adenoid hypertrophy; Model 3: Lower face width; Model 4: OSA-18 questionnaire (Item 1–4), pharyngeal grade, adenoid hypertrophy, lower face width.