
Figures & data
Table 1 Baseline Clinical Features of the Study Participants [M (P25, P75)/N (%)]
Figure 1 Process diagram for patient selection.
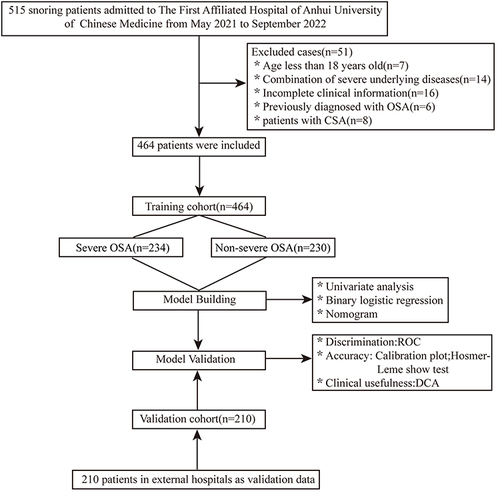
Table 2 General Characteristics of Patients in the Training Cohort
Table 3 Covariance Diagnosis and Binary Logistic Regression Analysis of Screening Predictors
Figure 2 Nomogram for the prediction of the occurrence of severe OSA in snoring patients.
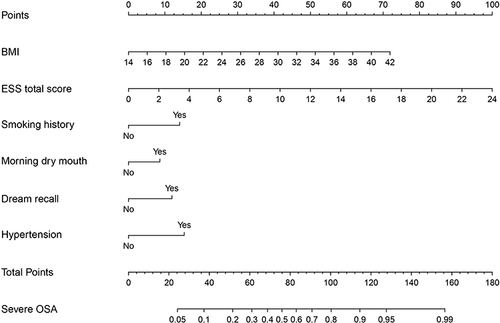
Figure 3 ROC curves. (A) Training cohort. (B) Validation cohort. ROC=receiver operating characteristic; AUC=area under the ROC curve.
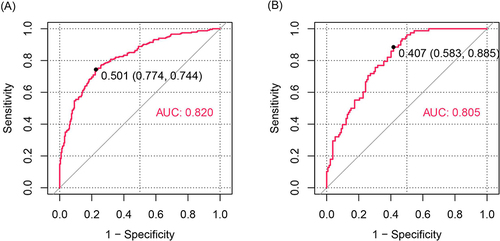
Figure 4 Calibration curves predicting the probability of severe OSA in snoring patients. (A) Training cohort. (B) Validation cohort.
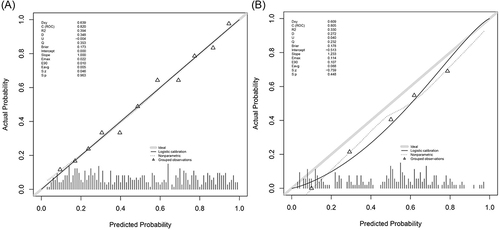
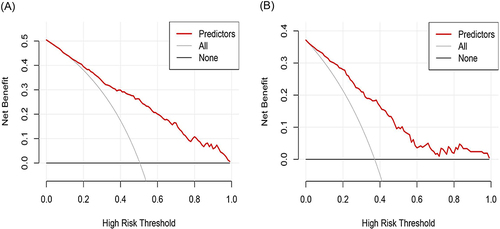
Figure 5 Decision curve analysis for predicting the occurrence of severe OSA in snoring patients. (A) Training cohort. (B) Validation cohort.
Data Sharing Statement
The data that support the findings of this study are available from the corresponding authors upon reasonable request.