
Figures & data
Figure 1 Study flowchart.
Abbreviations: HST, Home Sleep Apnea Test; OSA, Obstructive sleep apnea; APAP, Auto-adjusted positive airway pressure.
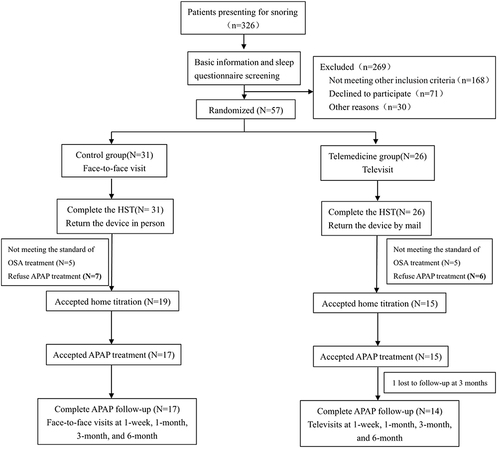
Table 1 Baseline Characteristics
Table 2 Acceptance Rate of APAP Treatment and Home Stress Titration
Table 3 Comparison of Change from Baseline in Questionnaire Scores Between the Telemedicine and Control Groups
Table 4 Comparison of Typical OSA Symptoms Between the Telemedicine and Control Groups
Table 5 Follow-Up of APAP Treatment
Table 6 Factors Influencing Adherence to APAP Therapy
Table 7 Cost Analysis
Table 8 Cost-Effectiveness Analysis
Table 9 Additional Interventions of Two Groups
Table 10 Characteristics of Subjects Receiving APAP Treatment in the Telemedicine Group
Data Sharing Statement
The datasets used or analyzed during the current study are available from the corresponding author upon reasonable request.