
Figures & data
Table 1 Population Characteristics
Table 2 Maternal and Paternal Sleep Characteristics at Each Time Point Postpartum (N = 188)
Figure 1 Flowchart of the population.
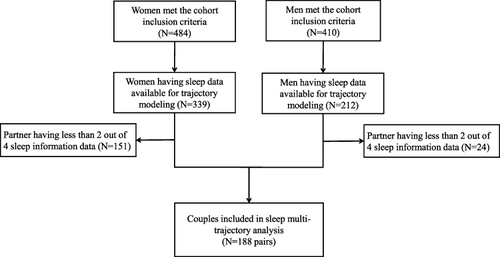
Figure 2 Sleep multi-trajectories from 3 to 36 months postpartum in the SEPAGES cohort. (A) Maternal sleep multi-trajectories (M1-M3). 1: M1 (N=37, 19.7%), 2: M2 (N=62, 33.0%), 3: M3 (N=89, 47.3%). Lines represent mean night and weekend daytime sleep duration and subjective sleep loss trajectories. (B) Paternal sleep multi-trajectories (F1-F3). 1: F1 (N=70, 37.2%), 2: F2 (N=35, 18.6%), 3: F3 (N=83, 44.1%). Lines represent mean night and weekend daytime sleep duration and subjective sleep loss trajectories. (C) Couple sleep multi-trajectories (C1-C3). M: maternal, F: paternal, C1 (N=55, 29.2%), C2 (N=52, 27.6%) and C3 (N=81, 43.1%). Lines represent mean night and weekend daytime sleep duration and subjective sleep loss trajectories.
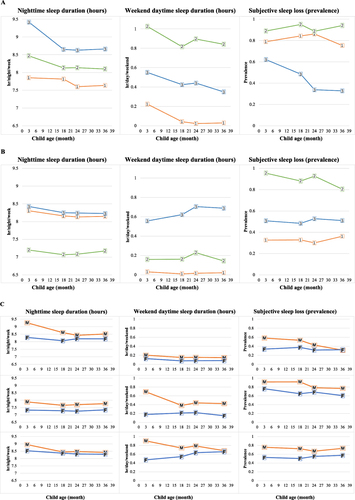
Table 3 Interrelations Between Maternal (M1-M3) and Paternal (F1-F3) Sleep Multi-Trajectories (N = 188 Pairs)
Table 4 Distribution of Maternal (M1-M3) and Paternal (F1-F3) Sleep Multi-Trajectory Groups According to Couples (C1-C3) Sleep Multi-Trajectory Groups (N = 188)
Table 5 Unadjusted and Adjusted Multinomial Logistic Regression for Couples Sleep Multi-Trajectory Groups (N = 188; C1 Was the Reference)