
Figures & data
Table 1 Patient Characteristics of Both OSA and CI Cohorts Separately and Together
Figure 1 Diagram that describes the data flow.
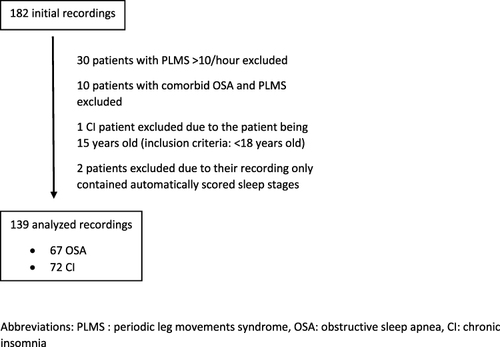
Table 2 Epoch-Level Sensitivity and Specificity of Scoring Sleep States Using Nox’s BodySleep Compared to Manually Scored Sleep States, Alongside 95% Confidence Intervals Bootstrapped on a Patient-Level
Table 3 Sensitivity and Specificity of Estimating Sleep-Disordered Breathing (SDB) Severity Using Estimated Sleep States from Nox’s BodySleep Compared to Estimating SDB Severity Using Manually Scored PSG Sleep Stages
Table 4 Sensitivity and specificity of estimating sleep-disordered breathing (SDB) severity estimated without sleep staging compared to estimating SDB severity using manually scored PSG sleep stages
Table 5 Confusion Matrix for Estimating SDB Severity Using Sleep States Estimated from Nox’s BodySleep Compared to Estimating SDB Severity Using Manually Scored Sleep Stages
Table 6 Confusion Matrix for Estimating SDB Severity Without Sleep Staging Compared to Estimating SDB Severity Using Manually Scored PSG Sleep Stages
Table 7 Summary Statistics Mean ± Standard Deviation (Min-Max) for Each Scoring Overall Recordings
Figure 2 Continued.
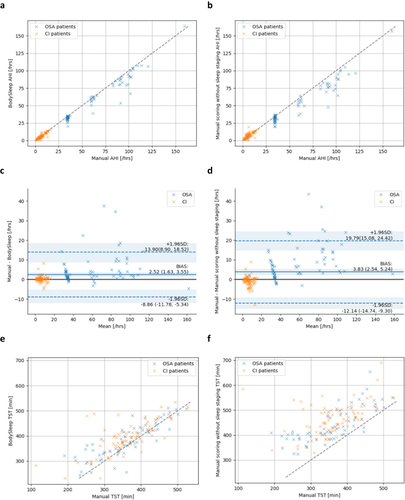
Figure 2 Scatter plots and Bland-Altman plots for the indices. The indices from the Nox BodySleepTM 1.0 and Manual scoring with no sleep scoring were compared against the manual scoring of polysomnography (PSG). (a–d): Apnea-Hypopnea Index (AHI), and (e–h): Total Sleep Time (TST). Sleep Efficiency (SE) and Wake after Sleep Onset (WASO) scatter plots (i and j) and Bland-Altman plots (k and l) from manually scored recordings vs recordings scored with the Nox BodySleep 1.0 algorithm, in both groups of patients with Obstructive Sleep Apnea (OSA) and with chronic insomnia.
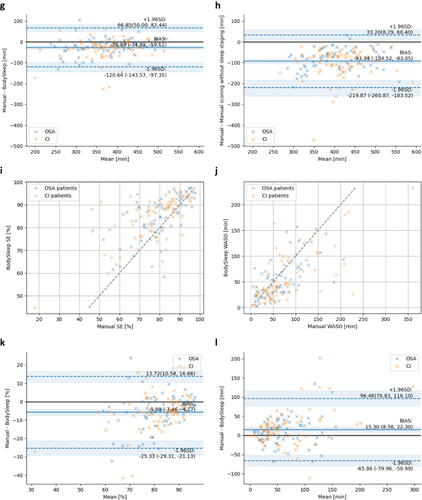
Table 8 The Median Pairwise Difference Between the Absolute Error of Manual PSG Scoring Vs Nox BodySleep and the Absolute Error of Manual PSG Vs Manual Without Sleep Staging
Table 9 Intraclass Correlation Between Parameters Inferred from Nox’s BodySleep Scorings versus the Parameters Calculated from Manual PSG Scorings for Each Cohort Alongside Bootstrapped 95% Confidence Intervals