Figures & data
Table 1 Paired t-Test Results for Insomnia Symptoms
Figure 1 Regularized GGMs of insomnia symptoms.
Notes: Each node represents a variable. Weight of edges (connection between nodes) is represented by the thickness and the color saturation of the edges. Positive connections are green and negative connections red. The pie chart surrounding each node represents node predictability. (A) Pre-lockdown network. (B) Peri-lockdown network.
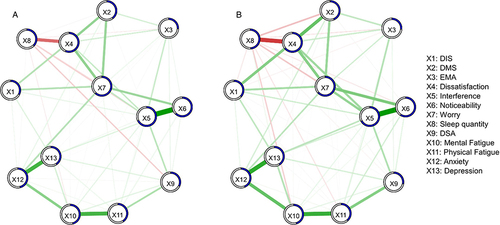
Figure 2 Centrality measures.
Notes: Peri, peri-lockdown; Pre, pre-lockdown.
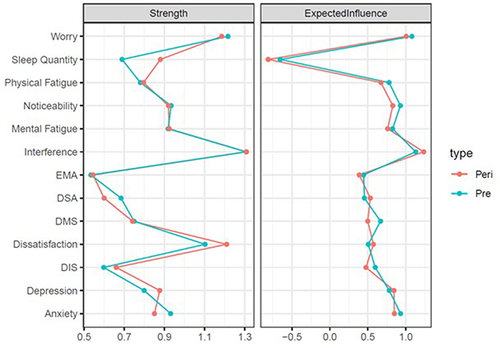
Table 2 Statistically Differing Edges Between Pre- and Peri-Lockdown GGMs
Table 3 Paired t-Test Results for Insomnia Symptoms
Figure 3 Regularized GGMs of insomnia symptoms.
Notes: Each node represents a variable. Weight of edges (connection between nodes) is represented by the thickness and the color saturation of the edges. Positive connections are green and negative connections red. The pie chart surrounding each node represents node predictability. (A) Pre-lockdown network. (B) Peri-lockdown network.
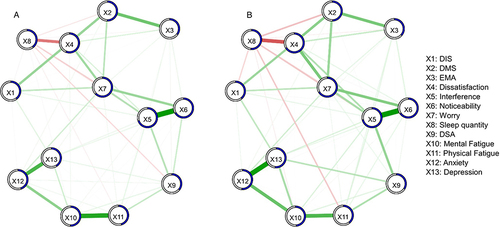
Figure 4 Centrality measures.
Notes: Peri, peri-lockdown; Pre, pre-lockdown.
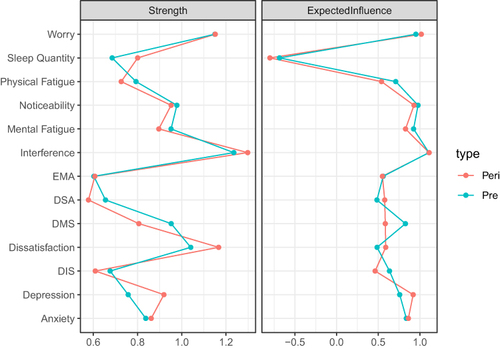
Table 4 Statistically Differing Edges Between Pre- and Peri-Lockdown GGMs
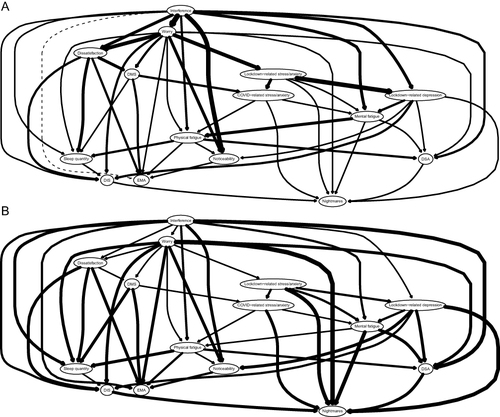
Figure 5 Directed acyclic graphs (DAGs).
Notes: (A) The thickness of an arrow indicates its importance to the overall network model fit (BIC value). Greater thickness indicates a greater contribution to model fit (non-significant arcs are plotted as dashed lines). (B) The thickness of an arrow indicates the likelihood of a given direction. Greater thickness corresponds to higher proportions of bootstrapped networks with the arrow pointing in that direction.