
Figures & data
Figure 1 A two-stage study design: observational study and Mendelian randomization.
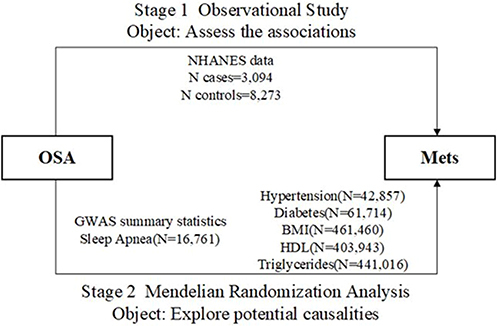
Figure 2 The flowchart of participants’ selection from the NHANES (2005–2008).
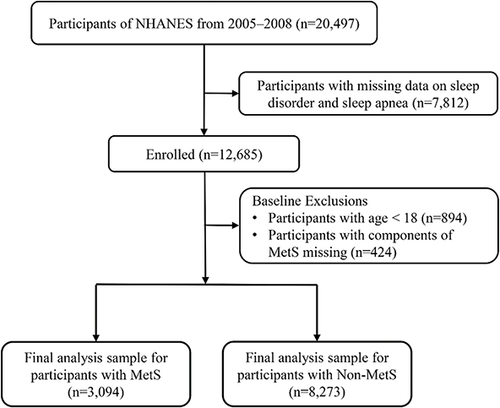
Figure 3 Principles of Two-sample Mendelian Randomization.
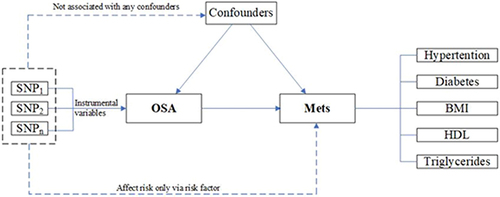
Table 1 Evaluation of Instrumental Variables and Data Sources
Table 2 Adult Participants’ Baseline Characteristics in the NHANES (2005–2008)
Figure 4 Stratified analysis of the association between sleep apnea and the incidence of MetS among adults in the NHANES (2005–2008).
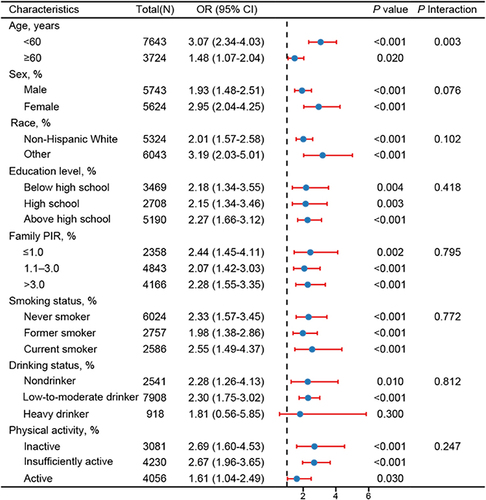
Table 3 HRs (95% CIs) of Cardiovascular and All-Cause Mortality According to Multiple Causes of OSA Among Adults in the NHANES (2005–2008)
Figure 5 Kaplan-Meier survival curves for all-cause (A) and cardiovascular (B) mortality grouped by sleep apnea among adults in the NHANES (2005–2008).
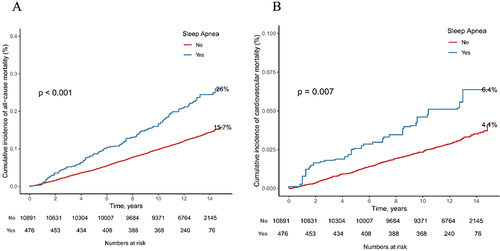
Table 4 ORs (95% CIs) of the Incidence of MetS and Its Components According to Multiple Causes of Sleep Disorders Among Adults in the NHANES (2005–2008)
Table 5 MR Estimates of OSA Concerning the Risk for CVDs
Figure 6 Visualization of causal influence of OSA on the incidence rates of Mets and CVD by scatter plots. Each point in the scatter plot represents a genetic variant, which shows us how each genetic variant (SNP) is associated with Exposure and Outcome. The magnitude of the causal relationship was indicated by the slope of the straight line. (A–E) Visualization of causal influence of OSA on the incidence rates of hypertension, diabetes, BMI, as well as on HDL and TG levels by scatter plots; (F) Visualization of causal influence of OSA on the incidence rate of CVD by the scatter plot.
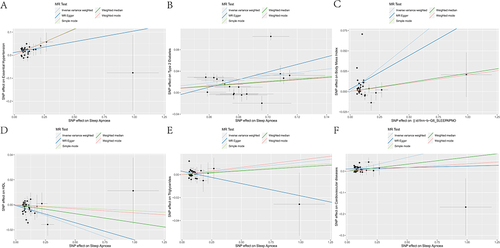
Table 6 Heterogeneity Test and Pleiotropy of OSA IVs from GWAS
Data Sharing Statement
The datasets presented in this study can be found in online repositories (https://www.finngen.fi/en; https://www.cdc.gov/nchs/nhanes/index.htm).