
Figures & data
Table 1 Characteristics of the Population (N = 93) Categorized by OSA Severity
Figure 1 Flow chart of patient recruitment and grouping, clinical data collection, sleep EEG processing and data analysis.
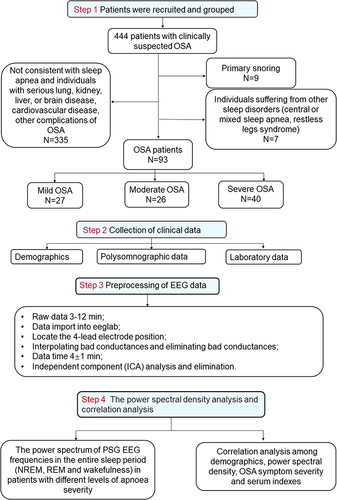
Figure 2 Polysomnographic characteristics in the mild OSA group, moderate OSA group, and severe OSA group. (A) The statistical results of ODI in OSA patients with different severity. (B) The SaO2<90% statistical results in OSA patients with different severity. (C) The percentage of time spent in different sleep periods. (D) The apnea hypopnea index (AHI) of OSA patients with different severity during NREM and REM periods. (E) The total sleep apnea hypopnea of OSA patients with different severity during NREM and REM periods. (F) The microarousal index of OSA patients with different severity during NREM and REM periods. Star symbols represent statistical significance levels: “****” represents p < 0.0001, “***” represents p < 0.001, “**” represents p < 0.01, “*” represents p < 0.05, no stars represent p > 0.05.
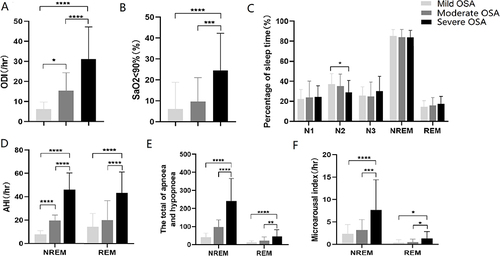
Figure 3 Comparisons of the absolute power spectral densities (PSD) in the mild OSA group, moderate OSA group, and severe OSA group during the whole sleep stages. The PSD of F3/F4 and O1/O2 channels in five frequency bands in OSA patients during N1 (A), N2(B), N3 sleep (C) and wakefulness (D). Star symbols represent statistical significance levels: “**” represents p < 0.01, “*” represents p < 0.05, no stars represent p > 0.05.
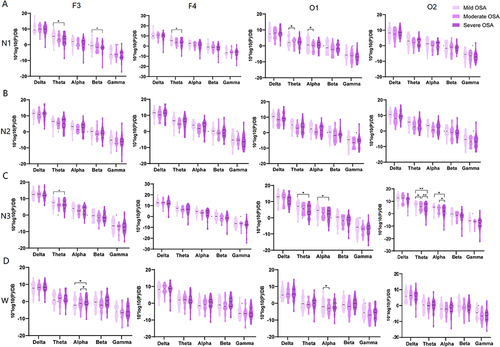
Figure 4 The topographic map results in the mild OSA group, moderate OSA group, and severe OSA group in each frequency band during N1, N2, N3 and wakefulness.
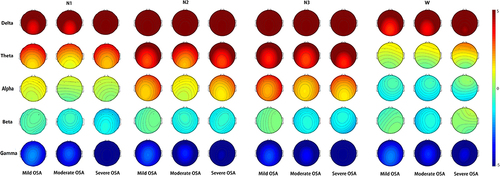
Figure 5 Correlation analysis between theta band power spectral density (PSD) in NREM sleep and severity of OSA symptom. The theta band power of F3/4 channels in N1 sleep was shown negatively correlated with AHI (A and B) (F3 channel: r=−0.3168, P=0.0021, F4 channel: r=−0.2770, P=0.0075), AHI during NREM (F3 channel: r=−0.3346, P=0.0011, F4 channel: r=−0.2962, P=0.0041), ODI (C and D) (F3 channel: r=−0.2712, P=0.0089, F4 channel: r=−0.2623, P=0.0115), SaO2<90% (E) (F3 channel: r=−0.2757, P=0.0078). The theta PSD of O1/2 channels in N3 sleep was negatively correlated with AHI (F and G) (O1 channel: r=−0.2138, P=0.0419; O2 channel: r=0.2421, P=0.0208) and Microarousal index (H and I) (O1 channel: r=−0.2616, P=0.0123, O2 channel: r=−0.3052, P=0.0033).
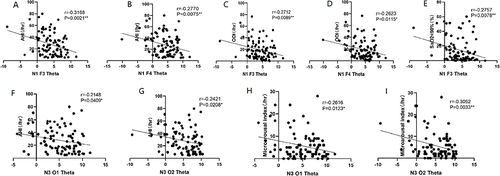
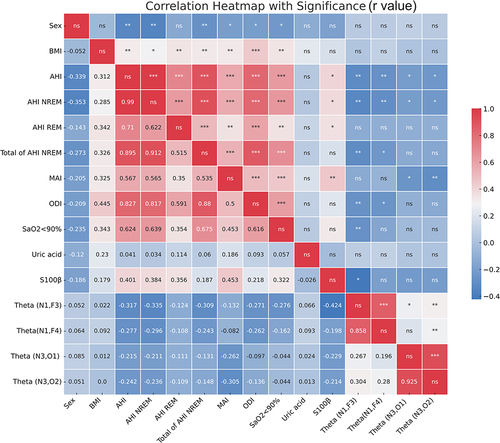
Figure 6 Matrix of Pearson’s correlation coefficients among demographics, power spectral density, OSA symptom severity and serum indexes. A color-coded correlation scale is presented on the right of the plot. Based upon the scale, blue ones stand for negative correlations and red ellipses stand for positive correlations, ns illustrate insignificant correlations of a given variable with itself. Star symbols represent statistical significance levels: “***” represents p < 0.001, “**” represents p < 0.01, “*” represents p < 0.05, no stars represent p > 0.05.
Data Sharing Statement
The data on which this manuscript are open to researchers upon appropriate request.