
Figures & data
Figure 1 Flowchart of the studied cohort of patients with iRBD and NREM parasomnia.
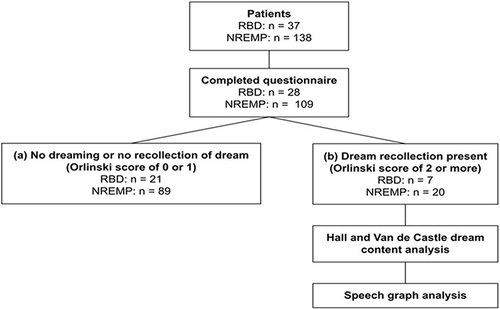
Figure 2 Representative speech graph transcribed from the dream reports of one iRBD and one NREMP patient. Adapted from Mota NB, Vasconcelos NA, Lemos N, et al. Speech graphs provide a quantitative measure of thought disorder in psychosis. PLoS One. 2012;7(4):e34928. Creative Commons.Citation36
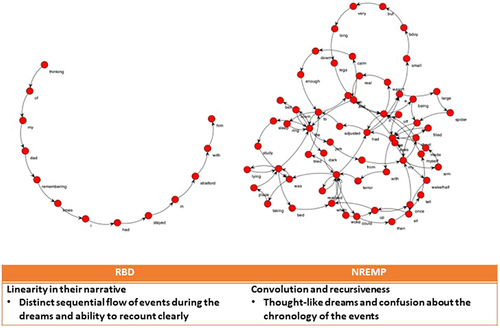
Figure 3 Continued.
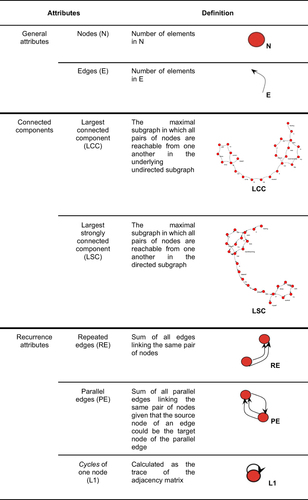
Figure 3 Speech graph attributes (SGA) and their definitions adapted from Mota NB, Vasconcelos NA, Lemos N, et al. Speech graphs provide a quantitative measure of thought disorder in psychosis. PLoS One. 2012;7(4):e34928. Creative Commons.Citation36
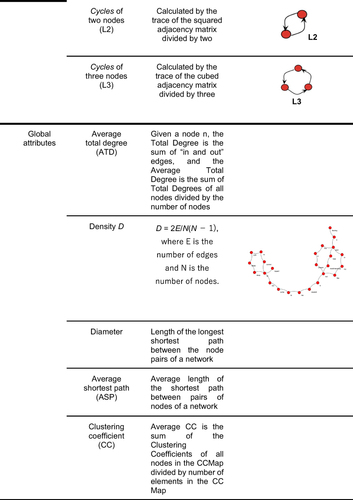
Table 1 Socio-Demographic and Sleep Parameters for iRBD and NREM Parasomnia Patients with Dream Recollection
Table 2 Orlinsky Scores of iRBD and NREMP Patients
Table 3 Characters Frequency and Percentage According to the Hall & Van de Castle Dream Content Analysis
Table 4 Hall & Van de Castle Analysis of Social Interaction, in Particular, Aggression