
Figures & data
Figure 1 Flowchart for the identification of the study population.
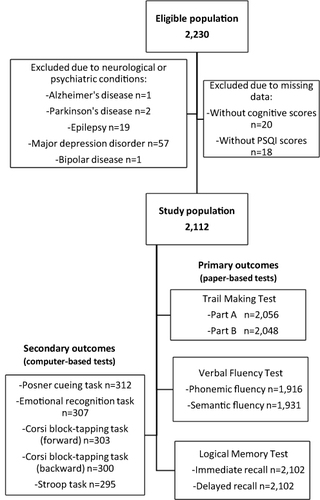
Table 1 Sociodemographic and Lifestyle Characteristics of Epirus Health Study Participants by Level of Sleep Quality
Table 2 Results of Multivariable Linear Regressions for the Cross-Sectional Association Between Sleep Quality (Continuous Score) and Cognitive Function (Continuous Score) Among Epirus Health Study Participants
Table 3 Results of Multivariable Linear Regressions for the Prospective Association Between Sleep Quality (Continuous Score) and Cognitive Function (Continuous Score) Among Epirus Health Study Participants
Table 4 Results of Multivariable Linear Regressions for the Association Between Sleep Quality and Cognitive Function (Continuous Score) with the Interaction Terms by Age Groups and Sex Among Epirus Health Study Participants