Figures & data
Figure 1 Preferred reporting items for systematic reviews and meta-analyses (PRISMA) flow diagram for study selection and exclusion.
Table 1 Study Participant Characteristics of the Included Studies
Figure 2 (A) Forest plot of the mean for Pittsburgh Sleep Quality Index (PSQI) total score in parents of children and adolescents with epilepsy; (B) funnel plot of studies estimating PSQI total scores in parents of children and adolescents with epilepsy, adjusted for unpublished reports (black dots).
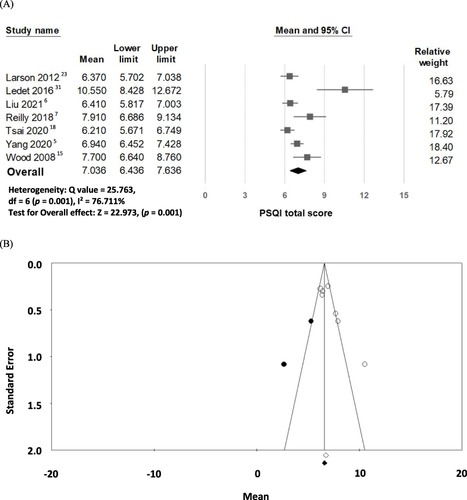
Table 2 Subgroup Analysis and Meta-Regression of Sleep Quality and Prevalence of Parental Sleep Disturbance
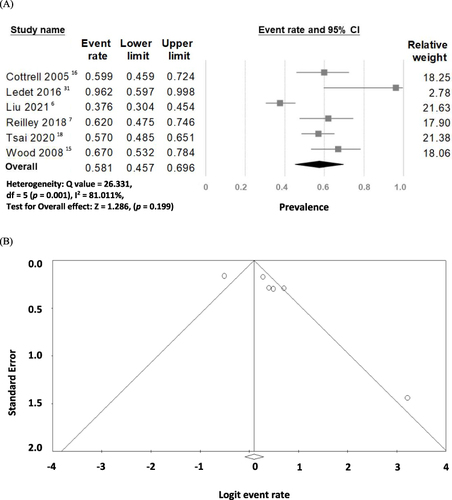
Figure 3 (A) Forest plot of the overall prevalence of sleep disturbances in parents of children and adolescents with epilepsy; (B) funnel plot of studies estimating the prevalence of sleep disturbances in parents of children and adolescents with epilepsy.