
Figures & data
Figure 1 Flow diagram of selection of participant (based on CMEC study).
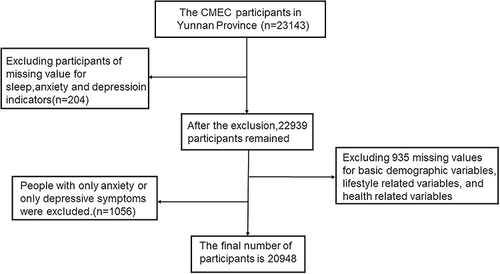
Table 1 Description of Demographic Characteristics of the Study Population [n (%)]
Table 2 Comparison of Prevalence of CDAS Among Residents with Different Demographic Characteristics [n (%)]
Table 3 Association Between Sleep Duration and Comorbid Depressive and Anxiety Symptoms (No-Stratified Analyses and Stratified Analyses)
Figure 2 The association between sleep duration, insomnia and CDAS after adjusting for covariates in Model 3. Model 3: Adjusted for ethnicity, age, gender, body mass index (BMI), previous occupation, household income, marital status, education level, smoking status, alcohol consumption, metabolic equivalents, asthma, coronary heart disease, stroke and Sleep duration/ The number of Insomnia types.
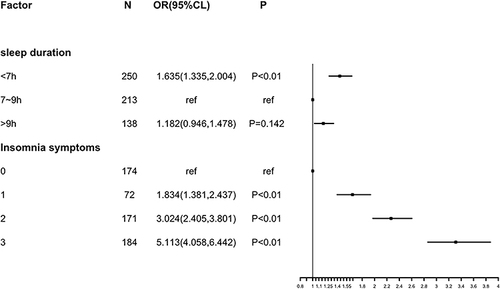
Figure 3 Dose-response relationship between sleep duration and CDAS (Model 1 and Model 3). Model 1: no adjustment. Model 3: Adjusted for ethnicity, age, gender, body mass index (BMI), previous occupation, household income, marital status, education level, smoking status, alcohol consumption, metabolic equivalents, asthma, coronary heart disease, stroke and the number of Insomnia types. The OR is shown with the blue solid line, and 95% CIs are shown with the shaded area. The black horizontal short dashed line represents the reference line y=1.
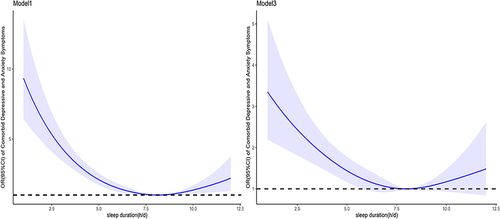
Table 4 Association Between Insomnia and Comorbid Depressive and Anxiety Symptoms