
Figures & data
Figure 1 The procedure of formal experiment.
Abbreviations: PANAS, positive affect and negative affect schedule; KSS, Karolinska Sleepiness Scale.
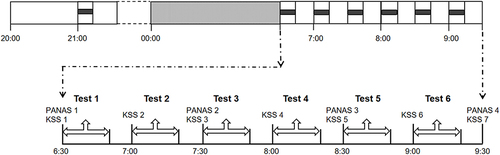
Table 1 The Statistical Results
Figure 2 The trajectory of subjective sleepiness. Error bars indicate 1 standard error of the mean. *p < 0.05, **p < 0.01.
Abbreviation: KSS, Karolinska Sleepiness Scale.
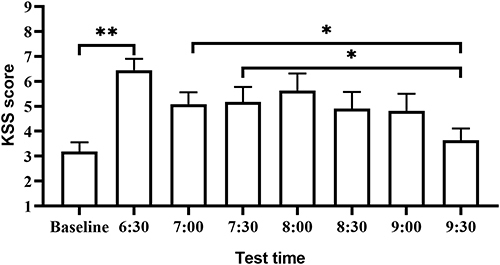
Figure 3 The trajectory of subjective mood. (A) Positive affect; (B) Negative affect. Error bars indicate 1 standard error of the mean. **p < 0.01.
Abbreviation: PANAS, positive affect and negative affect schedule.
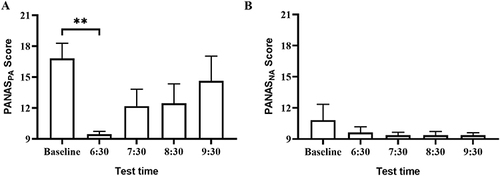
Table 2 The Descriptive Results of PVT and SCT Performance [M(SE)]
Table 3 The Correlations Between Microarousal and Subjective Mood and Selective Attention Performance [r(p)]