Figures & data
Figure 1 The amygdala subregions.
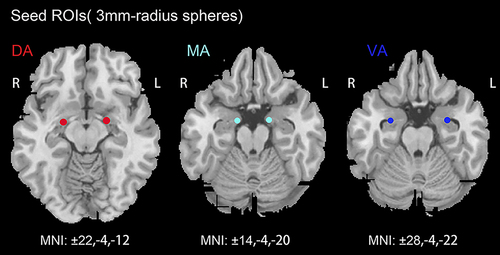
Table 1 Characteristics of Participant Demographics and Clinical Assessment Information
Table 2 Brain Areas Showing Functional Connectivity Disparities with Amygdala Subregions Between Pre-CPAP OSA and Post-CPAP OSA
Figure 2 The functional connectivity patterns of OSA patients at baseline and after six monthsCPAP treatment (single sample t-test).
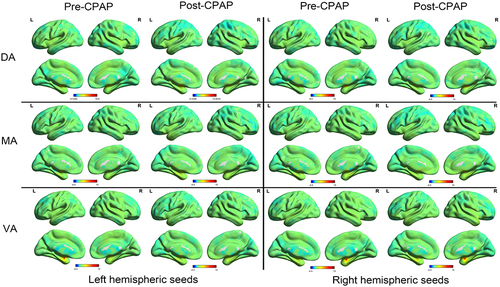
Figure 3 The altered FC in the amygdala subregions of OSA, the increased FC in post-CPAP compared to pre-CPAP OSA (warm color), the decreased FC in post-CPAP compared to pre-CPAP OSA (cold color); Gaussian random field theory (GRF) two-tail corrected with voxel level p < 0.01 and cluster level p < 0.05.
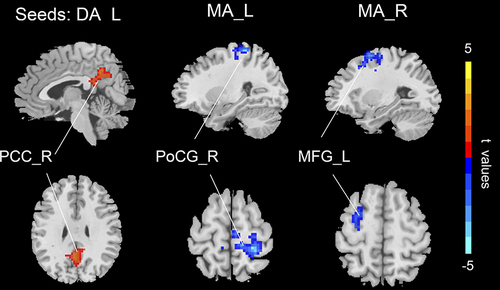
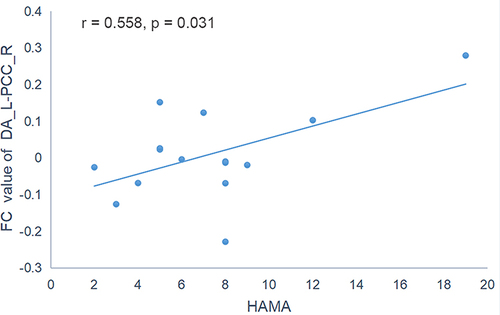
Figure 4 Correlation analyses between altered FC and HAMA in pre-CPAP patients with OSA.