Figures & data
Table 1 Baseline Characteristics of All Patients in the Training Cohort and Validation Cohort
Figure 1 Texture feature selection using the least absolute shrinkage and selection operator (LASSO) binary logistic regression model. (A) LASSO coefficient profiles of the 28 texture features. 28 factors to the forecast model: age, BMI, neck circumference, snoring, OMB, nasal obstruction, dysphagia, OSA-18, CSHQ, A/N, OMES, SNA, SNB, ANB, NP-FH, NA-PA, UI-LI, UI-SN, MP-SN, MP-FH, LI-MP, Y-axis angle, gender, symptom duration, learning problems, lack of concentration, level of obstruction, and tonsil size. (B) The optimal parameter (lambda) is selected using 10-fold cross-validation with minimum criteria in the LASSO logistic regression. Each red dot represents a lambda (λ) value on the path, and confidence intervals for the error rate are indicated. In drawing the black vertical lines, we used the minimum criteria and the one standard error of the minimum criteria (1-SE) to determine the optimal values. 5 factors to the forecast model: Neck circumference, ANB, gender, learning problem, and level of obstruction.
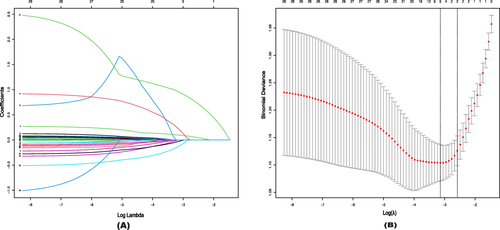
Figure 2 Nomogram for prediction of OSA.
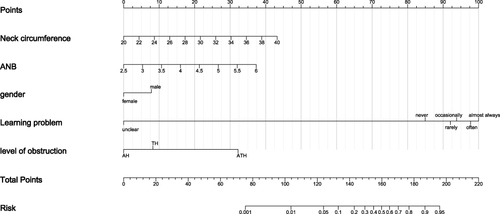
Figure 3 ROC curves for detecting OSA in children. (A) ROC curves for the five high-risk factors and overall in the training cohort. 1 represents the overall efficacy of the Nomogram model (Optimal Cutoff value:0.4; ACU: 0.841; Sens:80.2%; Spec:72.7%; PPV:67.5%; NPV:83.8%), 2 represents the predictive efficacy of the neck circumference (Optimal Cutoff value:28.6; ACU: 0.652), 3 represents the predictive efficacy of the ANB (Optimal Cutoff value:4.45; ACU: 0.547), 4 represents the predictive efficacy of the gender (Optimal Cutoff value:1; ACU: 0.594), 5 represents the predictive efficacy of the learning problem (Optimal Cutoff value:5; ACU: 0.558), and 6 represents the predictive efficacy of the level of obstruction (Optimal Cutoff value:3; ACU: 0.753). (B) ROC curves for the five high-risk factors and overall in the validation cohort. 1 (Optimal Cutoff value:0.38; ACU: 0.75; Sens:73.1%; Spec:69.5%; PPV:67.9%; NPV:74.5%), 2 (Optimal Cutoff value:28; ACU: 0.549), 3 (Optimal Cutoff value:4.3; ACU: 0.504), 4 (Optimal Cutoff value:1; ACU: 0.535), 5 (Optimal Cutoff value:6; ACU: 0.519), 6 (Optimal Cutoff value:3; ACU: 0.741). Optimal Cutoff value: A cut-point will be referred to as optimal when the point classifies most of the individuals correctly.
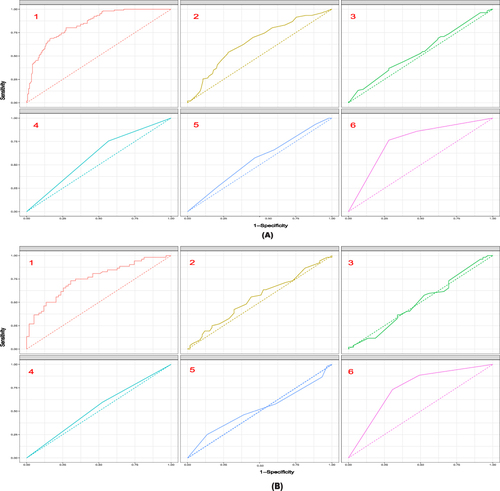
Figure 4 Calibration curve for predicting probability of OSA. (A) Training cohort. Parameter result: Dxy= 0.682; C (ROC) = 0.841; R2= 0.425; D= 0.375; U= −0.008; Q= 0.383; Brier= 0.162; Intercept= 0.000; Slope= 1.000; Emax= 0.029; E90= 0.022; Eavg= 0.011; S:z= 0.157; S:p= 0.875. (B) Validation cohort. Parameter result: Dxy= 0.501; C (ROC) = 0.750; R2= 0.127; D= 0.091; U= 0.051; Q= 0.040; Brier= 0.207; Intercept= 0.181; Slope= 0.596; Emax= 0.174; E90= 0.140; Eavg= 0.063; S:z= 2.016; S:p= 0.044. Thick gray line represents a perfect prediction by an ideal model. The Solid black line represents the performance of the nomogram, of which a closer fit to the diagonal dotted line represents a better prediction.
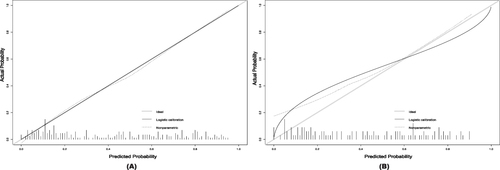
Figure 5 Decision curve analysis in prediction of OSA. (A) Training cohort. (B) Validation cohort. The y-axis demonstrates the net benefit. The red line indicates the nomogram. The yellow line indicates neck circumference. The green line represents ANB. The fluorescent green line indicates gender. The green dots represent learning problems. The blue dots represent the level of obstruction. The pink line indicates the assumption of no intervention. The intervention-all-patients assumption is represented by the purple line.
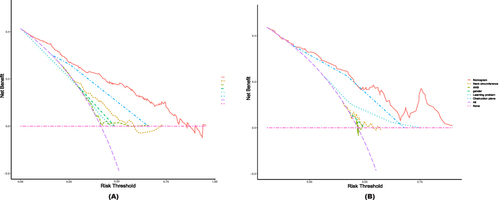
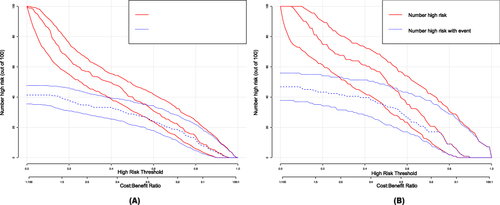
Figure 6 Clinical impact curve (CIC) of OSA model. (A) Training cohort. (B) Validation cohort. The red curve (number of high-risk individuals) indicates the number of people who are classified as positive (high risk) by the model at each threshold probability; the blue curve (number of high-risk individuals with outcome) is the number of true positives at each threshold probability. CIC visually indicated that nomogram conferred high clinical net benefit and confirmed the clinical value of the OSA model.