Figures & data
Figure 1 © ApniCure, Inc. The oral pressure therapy system consists of a bedside console containing a pump, a soft polymer mouthpiece, and a flexible tube connecting the mouthpiece to the console.
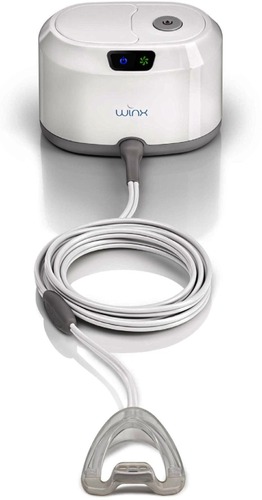
Figure 2 © ApniCure, Inc. With the mouthpiece in place, gentle oral vacuum creates a pressure gradient intended to move the soft palate against the tongue to relieve airway obstruction during sleep.
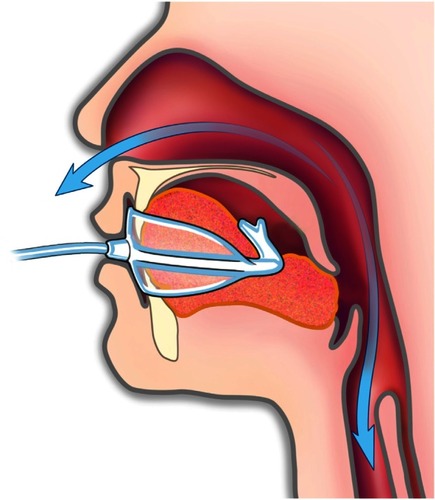
Figure 3 © ApniCure, Inc. An imprint of the teeth is obtained on a piece of wax (A) and compared to a visual template (B) to identify which one of the ten available mouthpiece sizes is most appropriate.
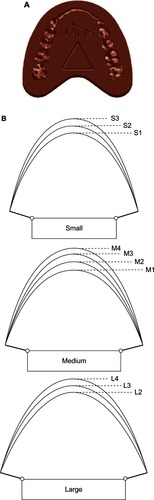
Figure 4 Individual apnea–hypopnea index (AHI) measures are shown with the horizontal lines denoting median and quartile values.
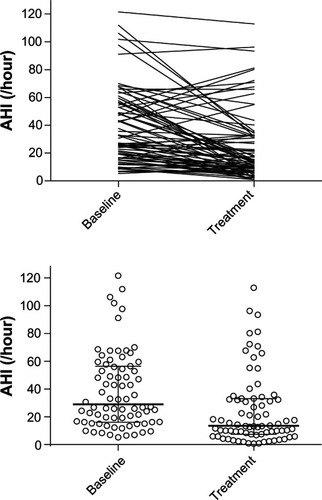
Figure 5 Based on AHI measurements at baseline and with treatment, OSA severity was identified for each subject and the portion of the 76-subject population at each severity level is shown.
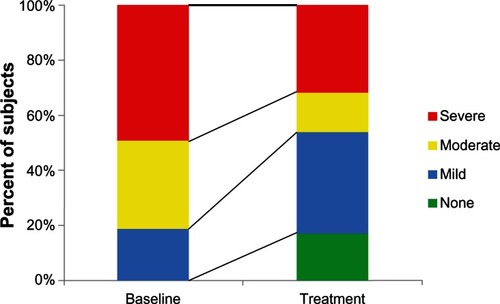
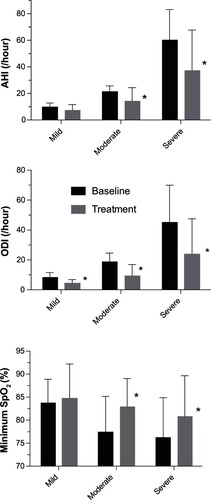
Figure 6 AHI, ODI, and minimum oxygen saturation for baseline and treatment conditions are shown as mean ± SD.
Abbreviations: AHI, apnea–hypopnea index; ODI, oxygen desaturation index; SD, standard deviation.