Figures & data
Table 1 The Correspondence Between Different Wavelet Scales and Their Central Frequencies
Table 2 Demographic and Clinical Characteristics of Participants in the Two Groups
Figure 1 The change trend of integral wavelet entropy during wake and different sleep stages in normal control group.
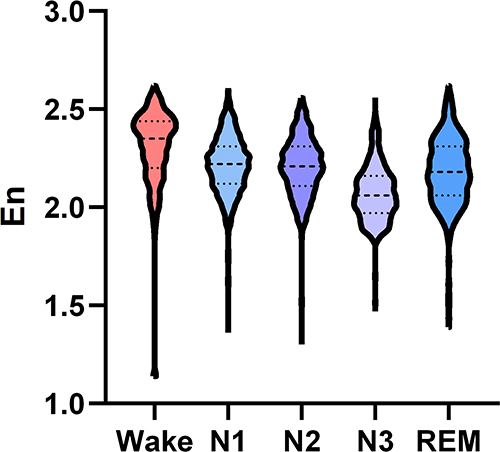
Table 3 Comparison of Integral Wavelet Entropy During Wake and Different Sleep Stages in Normal Control Group
Table 4 Comparison of Integral Wavelet Entropy During Wake and Different Sleep Stages in Insomnia Disorder Group
Figure 2 The change trend of integral wavelet entropy during wake and different sleep stages in insomnia disorder group.
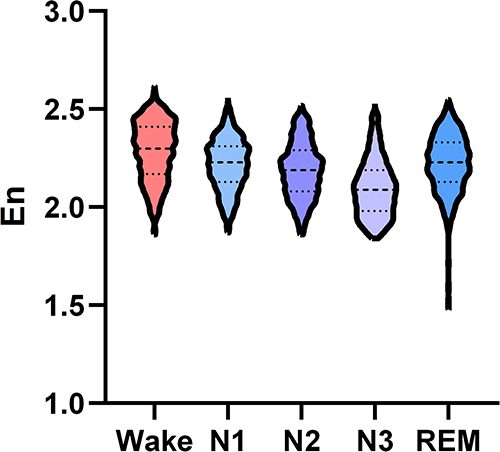
Table 5 The Comparison of Integral Wavelet Entropy During Wake and Different Sleep Stages Between the Insomnia Disorder and Normal Control Groups
Figure 3 Differences in the integral wavelet entropy during wake and different sleep stages between the insomnia disorder and normal control groups.
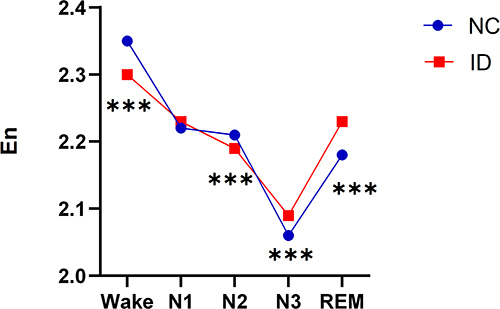
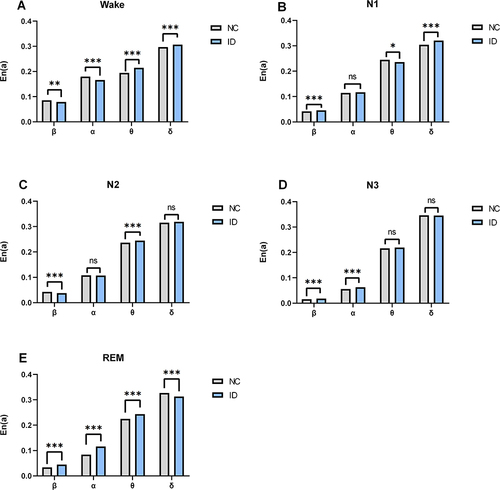
Figure 4 (A-E) The differences at the individual-scale wavelet entropy during wake and different sleep stages between the insomnia disorder and normal control groups.
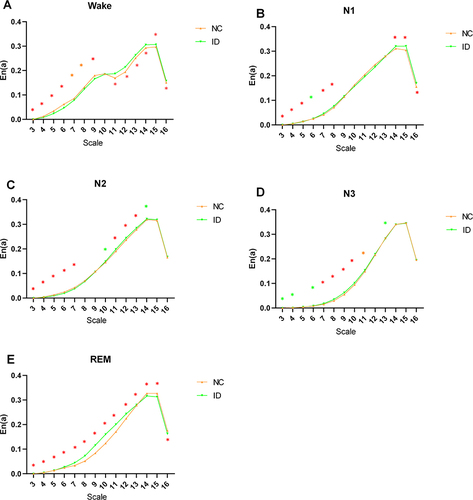
Figure 5 (A-E) The differences in the individual-scale wavelet entropy in different frequency bands during wake and different sleep stages between the normal control and insomnia disorder groups.