Figures & data
Figure 1 (A) Gender-wise Comparison of OSA Patient Distribution Over the Years. (B) Association of BMI with Age in Patients Diagnosed with OSA.
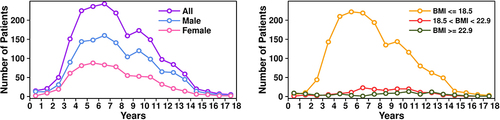
Figure 2 Distribution of OSA severity in the study population.
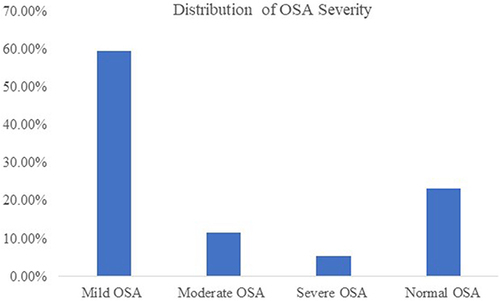
Figure 3 Prevalence of Coexisting Conditions in Pediatric Patients with Obstructive Sleep Apnea (OSA).
Abbreviations: SMA, Spinal Muscular Atrophy; BO, Brief Awakenings Occurrence.
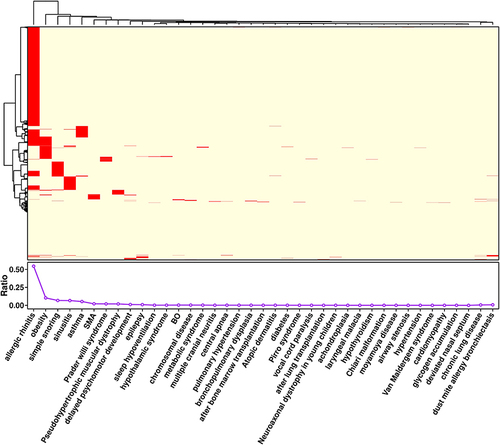
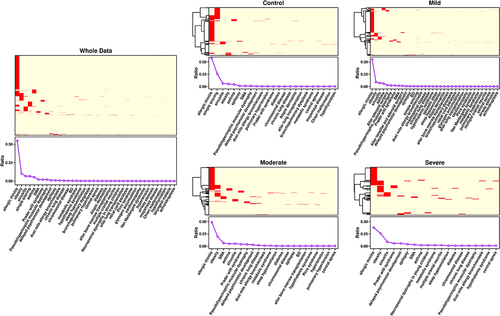
Figure 4 Comparison of Obstructive Sleep Apnea (OSA) Severity with Clinical Conditions and Co-morbidities in a Patient Cohort.
Abbreviations: SMA, Spinal Muscular Atrophy; BO, Brief Awakenings Occurrence.