Figures & data
Table 1 Comparison of General Data Between Patients with NT1 and the Control Group
Table 2 Comparison of PSG Parameters Between Patients with NT1 and the Control Group
Table 3 Comparison of ESS, GAD-7, PHQ-9, and FSS Scores Between Patients with NT1 and the Control Group
Figure 1 Comparison of anxiety propensity and brain fatigue between patients with NT1 and the control group (Ranks plot). (a) Comparison of anxiety propensity between NT1 patients and the control group; (b) Comparison of brain fatigue between NT1 patients and the control group.
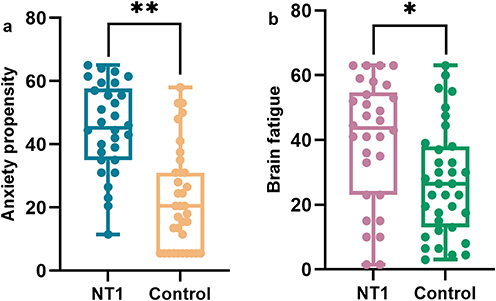
Figure 2 Correlation between FSS scores, mean sleep latency, and brain fatigue in patients with NT1. (a) Correlation between FSS scores and brain fatigue in patients with NT1; (b) Correlation between mean sleep latency and brain fatigue in patients with NT1; (c) Correlation between FSS scores and mean sleep latency in patients with NT1.
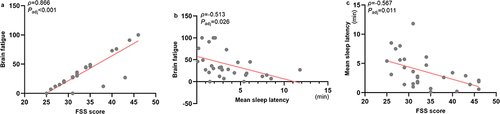
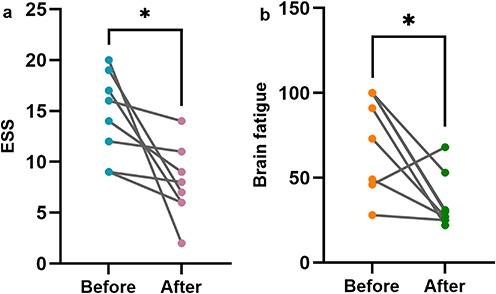
Figure 3 Changes in ESS scores and brain fatigue before and after drug treatment. (a) Changes in ESS scores before and after treatment; (b) Changes in brain fatigue before and after treatment.