Figures & data
Figure 1 Example from one participant of the predicted sleep/wake based on the full model (A), the predicted sleep/wake based on accelerometry alone (B), the scoring of sleep/wake based on polysomnography (C), the cyclic time features (D-I), the fitted circadian rhythm curve based on the estimated mid-point of sleep (J), the skin temperature (K and L), and the overnight recording of accelerometry (M-R).
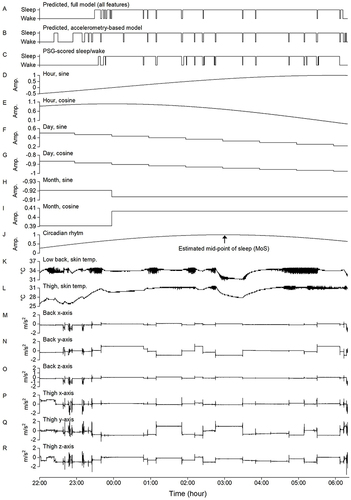
Figure 2 The three panels (A-C) illustrate the stepwise procedure used to train the machine learning (ML) model. In the first step (A), the ML model was trained using features derived from accelerometry (A), skin temperature data (T), and cyclic time (Cy). In the second step (B), the initial ML model trained in the first step was used to predict sleep/wake and determine the mid-point of sleep (MoS). A cosine wave with 24 h wavelength and maximum value at the MoS was used for the circadian rhythm curve approximation. In the third step (lower panel), the ML model was trained using all feature input (ie, A, T, Cy, and Ci).
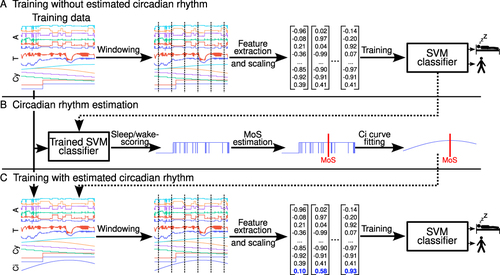
Table 1 Absolute Difference (Min) Between the Midpoint of Sleep (MoS) Derived from Polysomnography and the MoS Predicted by the Machine Learning Model Receiving Different Combinations of Feature Input. Values are Mean (SD)
Table 2 The Specificity, Sensitivity, and F1-Score of the Leave-One-Subject-Out Cross-Validations When Using Different Feature Combinations as Input to the Machine Learning Model
Figure 3 Change in performance metrics when removing different feature modalities (ie, estimated circadian rhythm, skin temperature, or cyclic time) as input to the machine learning model compared to the model receiving all feature inputs. The bars are mean values and the error bars SD.
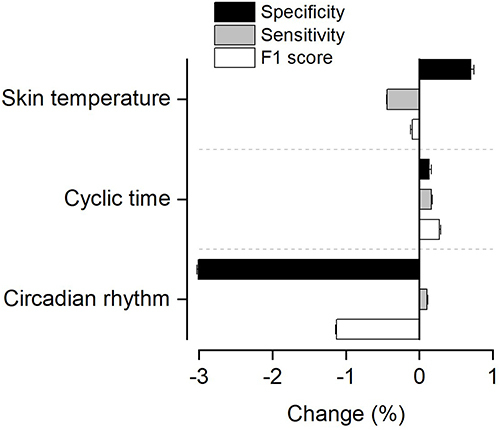
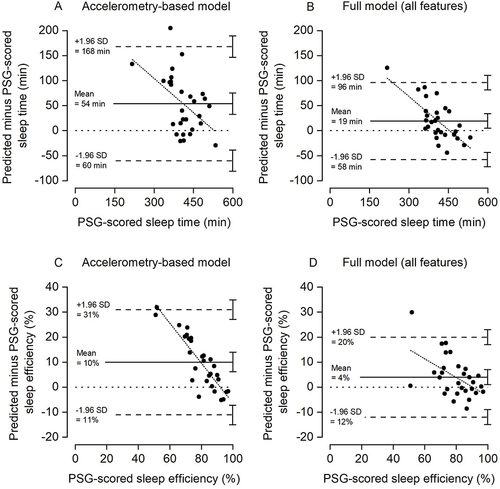
Figure 4 Bland-Altman plots indicating the difference in total sleep time (A and B) and sleep efficiency (C and D) predicted by the machine learning model when including accelerometry-derived features (A and C) and all features (B and D) versus the PSG-scored sleep time. The upper and lower dashed lines indicate the 95% limits of agreement and middle solid line the mean difference. The dotted horizontal line indicates zero (ie, line of equality). The regression line is indicated by the short, dotted line. The error bars on the right side indicate the 95% confidence interval for the limits of agreement and the mean difference.