Figures & data
Table 1 Baseline Body Weight Between the HFD and ND Group
Table 2 Metabolic Parameters of NM, IH and HR Group
Figure 1 Timeline protocol for intermittent hypoxia/reoxygenation (IH/R) procedures in diet-induced obese (DIO) rat model.
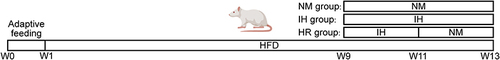
Figure 2 Impact of IH/R on gut microbial diversity at the species level. (A) α-diversity is depicted by box plots presenting Pielou, Shannon, Simpson, and Invsimpson indices. (B) Principal coordinate analysis (PCoA) was assessed using Bray-Curtis distances. Data were presented as mean ± SEM. Comparison among multiple groups was Kruskal-Wallis H-test. n=15 per group. *p<0.0167.
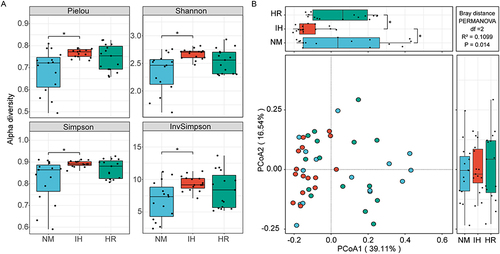
Figure 3 IH/R altered the gut microbial distributions in DIO rats. (A) Community distribution bar plot at the phylum level, and (B) relative abundance of the top 4 most abundant phyla. (C) Community distribution bar plot at the family level, and (D) relative abundance of the top 15 most abundant families. (E) Community distribution bar plot at the genus level, and (F) relative abundance of the top 15 most abundant genera. Data were presented as mean ± SEM. Comparison among multiple groups was Kruskal-Wallis H-test. n=15 per group. *p<0.0167.
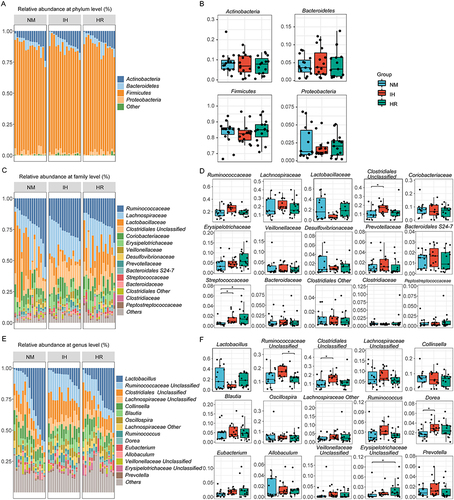
Figure 4 Heatmap depicting 11 significant pathways selected from 328 predicted KEGG metabolic pathways. n=15 per group. Color indicates correlations according to Spearman correlation coefficients (blue=negative, red=positive).
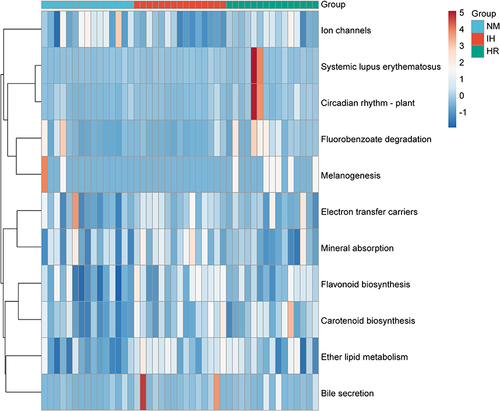
Figure 5 Redundancy analysis (RDA) tri-plot was performed on the microbial families and metabolic parameters (body weight, IL-6, leptin, and Ang-II). Purple arrows represent microbial families, yellow arrows represent metabolic parameters, arrow length indicates correlation strength, and arrow direction reflects parameter trends. Angle formed signifies correlation direction, with sharp angles denoting positive correlation and obtuse angles denoting negative correlation.
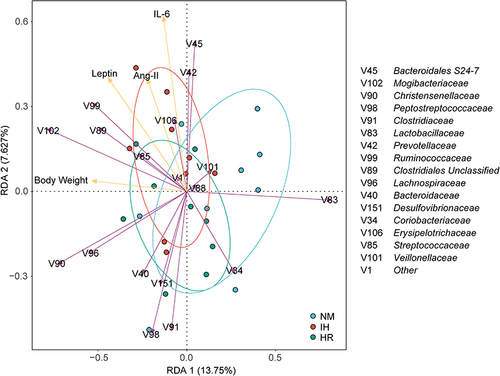
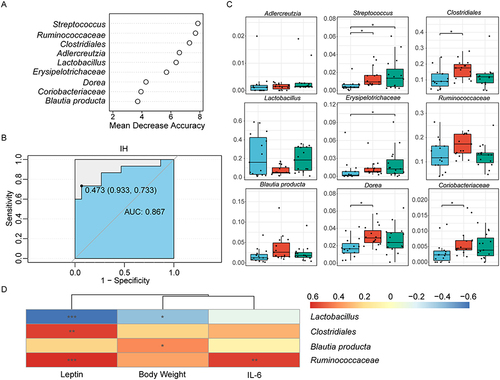
Figure 6 Identification of characteristic biomarkers in the DIO rats model related to IH by random forest analysis. (A) Screening of 9 biomarker species based on rank according to mean decrease accuracy score in the random forest predictive model. (B) Assessment of discriminatory ability by the receiver operating characteristic curve (ROC). (C) Relative abundances of the 9 filtered biomarker species. Data were presented as mean ± SEM. Comparison among multiple groups was Kruskal-Wallis H-test. *p<0.0167. (D) Correlations between metabolic parameters and biomarker species, with color representing Spearman correlation coefficients (blue=negative, red=positive, *p<0.05, **p<0.01, ***p<0.001). n=15 per group.