
Figures & data
Figure 1 Measurements of craniofacial skeletal parameters on cone-beam computed tomography (CBCT). Maxillary length: distance between anterior and posterior nasal spine; anterior maxillary width: distance between left and right upper 3 dentin-enamel junction; posterior maxillary width: distance between the left and right maxillary tuberosity; mandibular width: distance between left and right 3D Gonion; mandibular total length: distance between the 3D condyle and mental protuberance; mandibular body length: distance between the angle of the mandible and mental protuberance; mandibular ramus height: distance between the 3D Gonion and condyle.
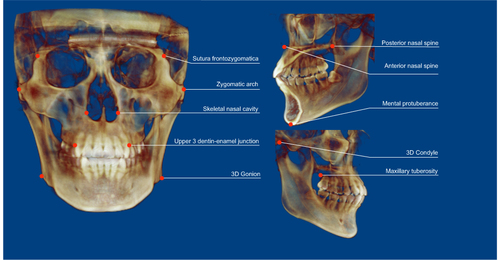
Figure 2 Measurement of upper airway structures. The upper airway is marked in pink. (A) Segmentation of upper airway and measurement of height; (B) measurement of cross-sectional area, width, and sagittal diameter.
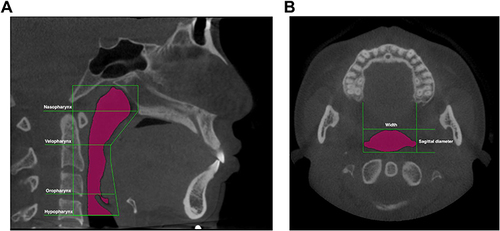
Figure 3 Scattergram for two clusters segregated by cluster analysis.
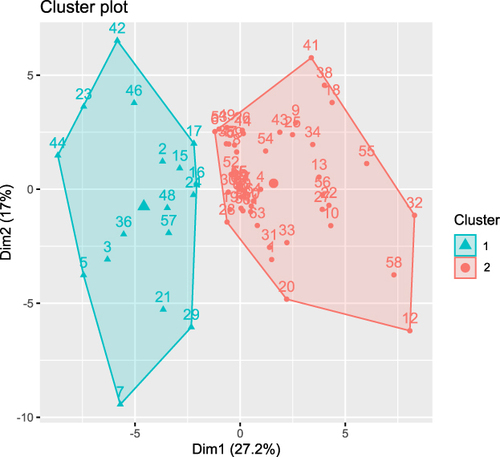
Figure 4 The difference in respiratory disturbance index (RDI) between clusters. **p<0.01.
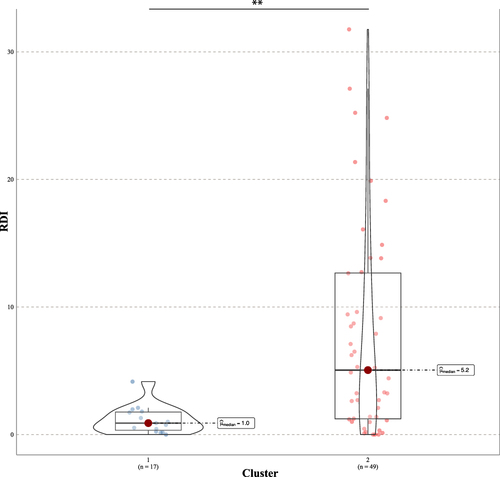
Table 1 The Polysomnographic Characteristics Between Subgroups
Figure 5 The difference in the average duration of groaning events between clusters. **p<0.01.
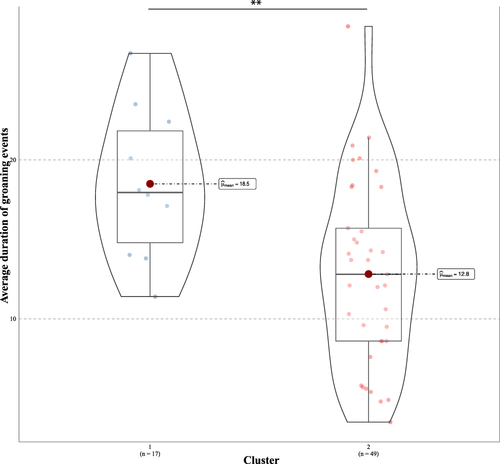
Table 2 The Characteristics of Groaning Events Between Subgroups
Table 3 The Craniofacial Anatomical Characteristics Between Subgroups Measured with Cone-Beam Computed Tomography (CBCT)
Figure 6 The difference in the upper airway volume between clusters. ***p<0.001.
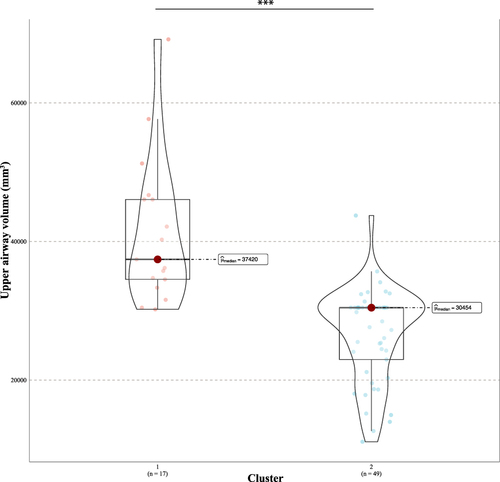
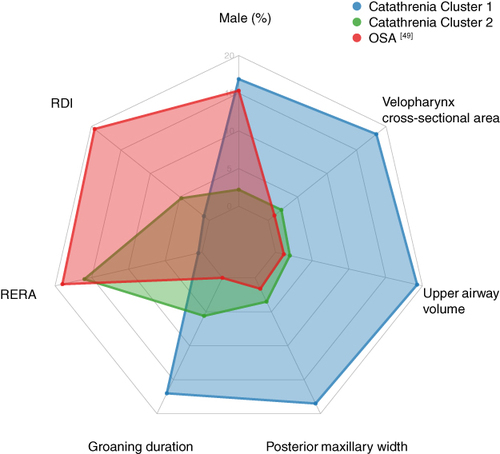
Figure 7 Two phenotypes of catathrenia identified in the study, compared with OSA. Data of OSA was extracted from reference.Citation49 Patients with catathrenia in cluster 2 exhibit similarities to those with OSA on several parameters, while those in cluster 1 do not.
Data Sharing Statement
The data underlying this article cannot be shared publicly for the privacy of individuals who participated in the study. The data will be shared on reasonable request to the corresponding author.