Figures & data
Table 1 Socio-Demographic and Health Factors of the Study Sample
Figure 1 Mean sleep onset time by age groups in men (p <0.001), women (p <0.001), and the total sample study (p <0.001). Women had significantly earlier sleep-onset time than men (23:02±1:23 versus 23:17±1:42; p <0.001) and both genders tended significantly to go to bed earlier with increasing age (p <0.001).
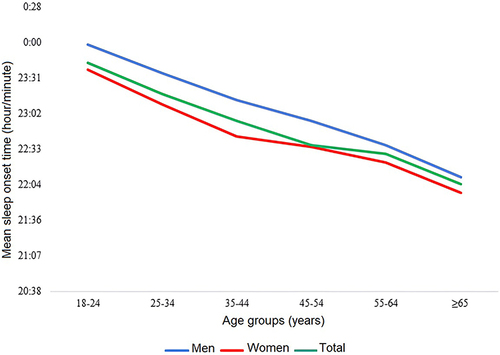
Figure 2 Mean rise time by age groups in men, women, and total sample (p <0.001 each). Overall, the mean rise time showed a strong significant U-shaped association with age groups, reached the minimum about age 55–64 years then started to increase again (p < 0.001).
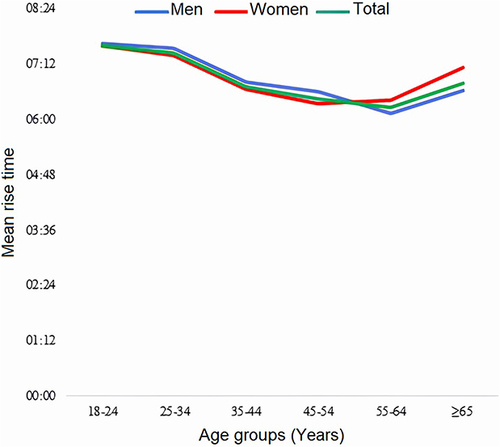
Figure 3 (a–f) Distribution of sleep duration by age groups (a) A U-shaped association was found between mean sleep duration and age groups (p < 0.001). Sleep duration by PSQI (b), ISI (c), ESS (d), PHQ-9 (e) and WHO-5 (f) scores. Participants with poor sleep quality (<0.001), insomnia (p<0.001) EDS (0.001), severe depression (p=0.022) or impaired well-being (<0.001) slept for a much shorter duration. PHQ-9: Patient Health Questionnaire. PSQI: Pittsburgh Sleep Quality Index. ISI: Insomnia Severity Index. ESS: Epworth Sleepiness Scale. World Health Organisation- Five Well-Being Index.
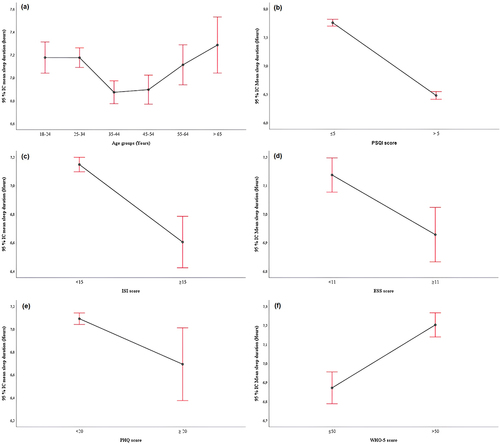
Figure 4 A scatter plot showing a moderate negative correlation between sleep duration and PSQI score. PSQI: Pittsburgh Sleep Quality Index (r=−0.523; p <0.001).
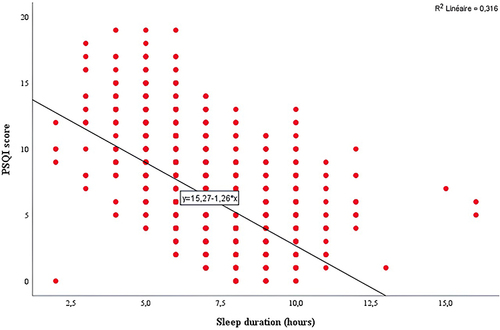
Table 2 Prevalence Rates of Poor Sleep Quality, Insomnia and Excessive Daytime Sleepiness by Sociodemographic Factors
Table 3 Prevalence Rates of Poor Sleep Quality, Insomnia and Excessive Daytime Sleepiness by Health Factors
Figure 5 Prevalence rates of high risk of OSA by age groups in men (p=0.008), women (p <0.001) and the total sample study (p<0.001). Overall, the risk of OSA increased in early adulthood, peaked around middle age (45–54 years), and then declined again. OSA: obstructive sleep apnea.
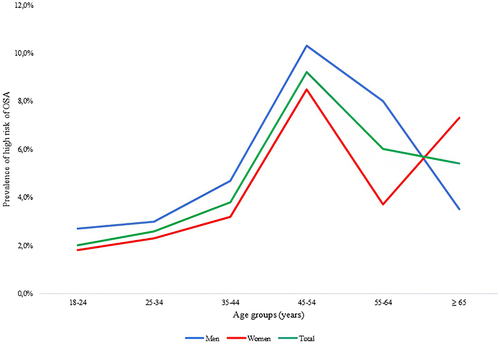
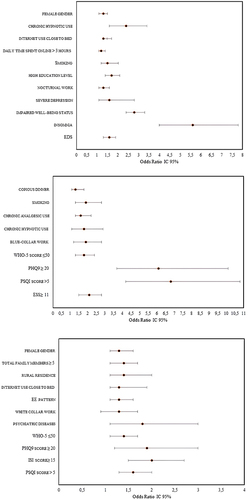
Figure 6 Multivariable binary logistic regression analysis on the association between poor sleep quality, insomnia and EDS with predictors. EDS: excessive daytime sleepiness. World Health Organisation- Five Well-Being Index. PHQ-9: Patient Health Questionnaire. PSQI: Pittsburgh Sleep Quality Index. ISI: Insomnia Severity Index. ESS: Epworth Sleepiness Scale.