
Figures & data
Figure 1 Flow chart of the case–control study. *By Figdraw.
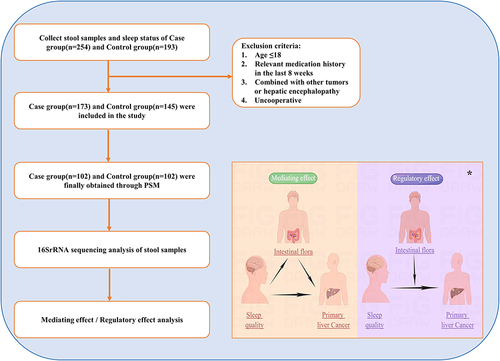
Figure 2 Clinicopathological features of individuals with and without Primary Liver Cancer. *P < 0.05; **P < 0.01; ***P ≤ 0.001.
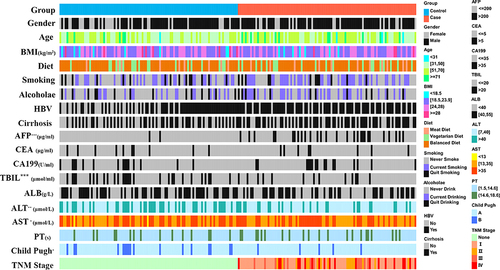
Figure 3 Analysis and description of differences in alpha diversity and beta diversity of gut microbiota between the individuals with and without Primary Liver Cancer. (A) Observed_otus; (B) Goods_coverage; (C) Chao Index; (D) Simpson Index; (E) PCoA of weighted Unifrac distance matrix; (F) NMDS Analysis; *P < 0.05; **P < 0.01; ***P < 0.001.
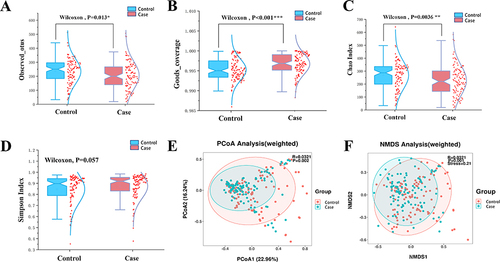
Figure 4 Differences of gut microbiota between the individuals with and without Primary Liver Cancer. (A) Predominant taxa distribution in two group were showed in a phylogenetic tree with clad-ogram; (B) Differential flora between two group were showed with the bar plot.
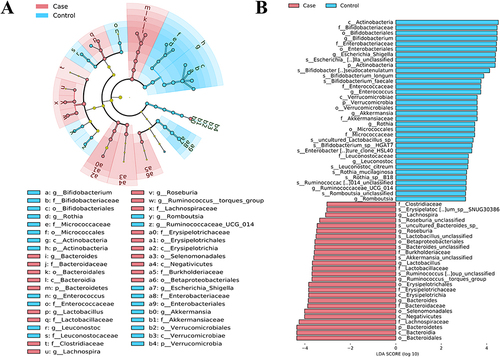
Table 1 The Mediation Effects of Various Levels of Gut Microbiota on the Relationship Between Sleep Quality and Primary Liver Cancer
Table 2 The Moderation Effects of Various Levels of Gut Microbiota on the Relationship Between Sleep Quality and Primary Liver Cancer
Table 3 The Mediation Effects of Various Levels of Gut Microbiota on the Relationship Between Specific Sleep Disorder and Primary Liver Cancer
Table 4 The Moderation Effects of Various Levels of Gut Microbiota on the Relationship Between Specific Sleep Disorder and Primary Liver Cancer
Data Sharing Statement
All GWAS summary statistics analysed in this study are publicly available for download by qualified researchers. The GWAS for the disorder of the sleep-wake schedule was provided by the Finland Database (https://r9.finngen.fi/pheno/F5_SLEEPWAKE). The GWAS for PLC was provided by the UK Biobank (https://github.com/Nealelab/UK_Biobank_GWAS). All data used to support the conclusions of the case–control study are accessible upon reasonable request from the principal investigator.