
Figures & data
Figure 1 Bidirectional MR research flowchart for CIPs and OSA.
Note: This figure elucidates the three foundational assumptions of MR: relevance, independence, and exclusion restriction.
Abbreviations: IVs, instrumental variables; MR, Mendelian randomization; CIPs, circulating inflammatory proteins; OSA, obstructive sleep apnea.
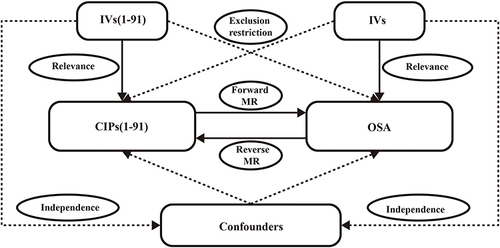
Figure 2 The positive results of the bidirectional MR analysis conducted with the IVW method.
Notes: NSNP, the number of SNPs used in the analysis; MR Egger_Q_P, The P-value from the Cochran Q-test computed using the MR Egger method; IVW_Q_P, The P-value from the Cochran Q-test computed using the IVW method; Pleiotropy_P, the P-value of the MR-Egger regression intercept hypothesis test; MR PRESSO_P, the P-value of the horizontal pleiotropy test in MR-PRESSO.
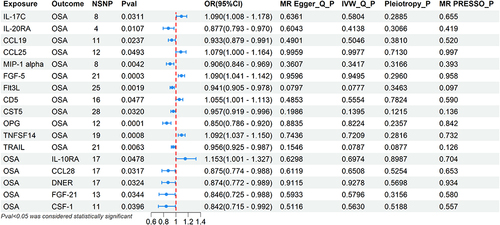
Figure 3 Scatter plots of the causal effects of CIPs associated SNPs on OSA.
Abbreviations: (A) IL-17C, interleukin-17C; (B) CCL25, C-C motif chemokine 25; (C) FGF-5, fibroblast growth factor 5; (D) CD5, T-cell surface glycoprotein CD5; (E) TNFSF14, tumor necrosis factor ligand superfamily member 14; (F) IL-20RA, interleukin-20 receptor subunit alpha; (G) CCL19, C-C motif chemokine 19; (H) MIP-1 alpha, macrophage inflammatory protein-1 alpha; (I) Flt3L, Fms-related tyrosine kinase 3 ligand; (J) CST5, cystatin D; (K) OPG, osteoprotegerin; (L) TRAIL, TNF-related apoptosis ligand.
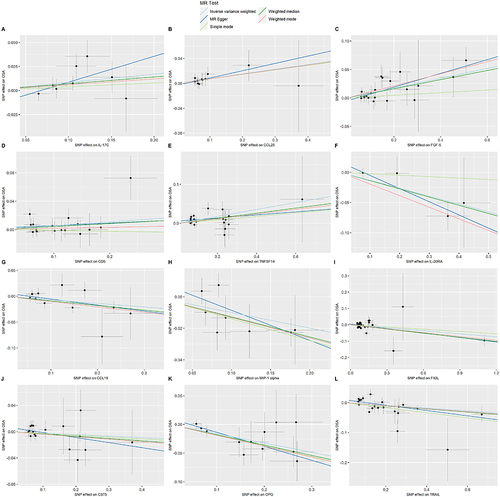
Figure 4 Circular heatmap of bidirectional MR analysis.
Notes: (A) The circular heatmap with CIPs as the exposure and OSA as the outcome. (B) The circular heatmap with OSA as the exposure and CIPs as the outcome. The circular heatmap, from outer to inner layers, represents the P-values obtained from five MR methods (IVW, MR Egger, Weighted median, Simple mode, Weighted mode), with the innermost layer depicting the OR values obtained from the IVW method.
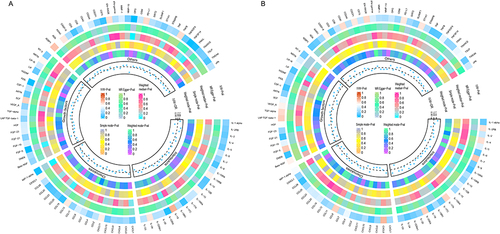
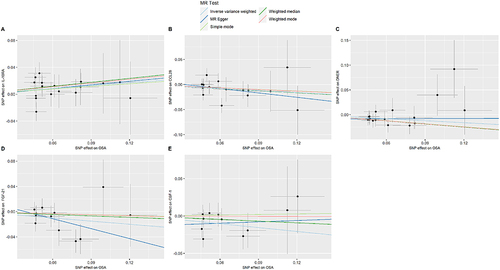
Figure 5 Scatter plots of the causal effects of OSA associated SNPs on CIPs.
Abbreviations: (A) IL-10RA, interleukin-10 receptor subunit alpha; (B) CCL28, C-C motif chemokine 28; (C) DNER, delta and notch-like epidermal growth factor-related receptor; (D) FGF-21, fibroblast growth factor 21; (E) CSF-1, macrophage colony-stimulating factor 1.
Data Sharing Statement
The original contributions proposed in this study are located in the main text/supplementary materials. The GWAS data used has been appropriately cited. Further inquiries can be directed to the corresponding author.