
Figures & data
Figure 1 Overall study design of genome-wide cross-trait analysis.
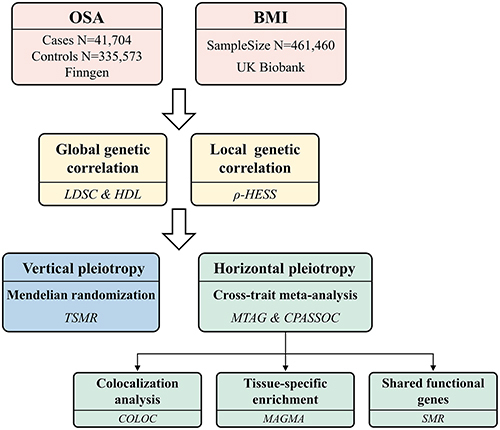
Figure 2 Local genetic correlation between OSA and BMI. Manhattan plot displayed the calculations of the local genetic correlation and local genetic covariance between OSA and BMI, along with their respective local SNP heritability. The presence of red and blue bars in “local genetic correlation” and “local genetic covariance” indicate significant regions sharing SNP heritability. These regions meet the criteria (P < 5e-08 in local SNP heritability test, and P < 0.05/1703 in local genetic covariance test).
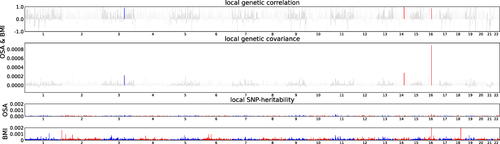
Figure 3 Forest plots of bidirectional MR analysis between OSA and BMI. (A) forward MR analysis; (B) reverse MR analysis.
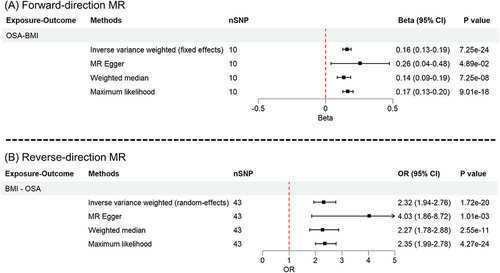
Figure 4 Tissue specific enrichment of SNP heritability for OSA and BMI. A total of 12 tissues were shared in enrichment of SNP heritability for OSA and BMI after adjustment (P < 0.005/54). Blue line indicates threshold 0.05 for P value, and red line indicates 0.05/54.
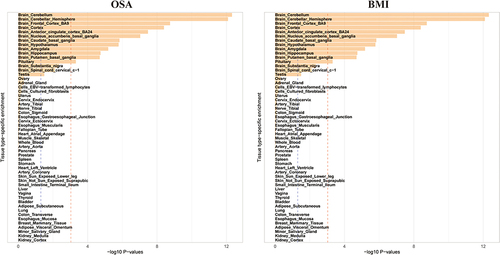
Table 1 Six Genes Obtained from the Intersection of Genes Identified by SMR and Those Associated with Colocalized SNPs
Data Sharing Statement
The GWAS summary statistics for OSA and BMI are publicly available from https://r9.finngen.fi/, and https://gwas.mrcieu.ac.uk/, respectively.