Figures & data
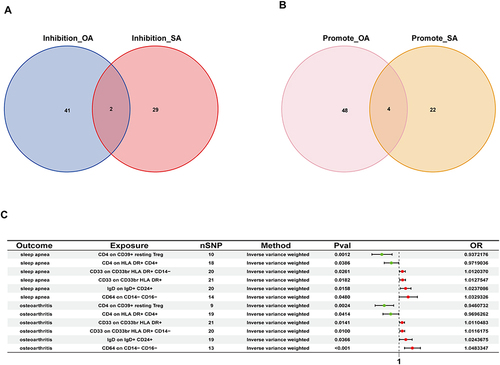
Figure 1 Results of Mendelian randomization of OA and SAS.
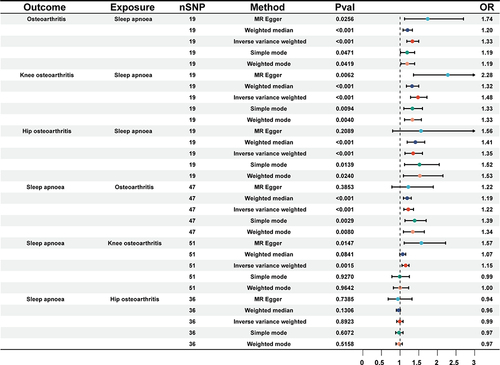
Figure 2 Volcano plot and WGCNA for SAS and OA: (A) Volcano plot of OA (B) Volcano plot of SAS (C) Determination of soft threshold power for OA (D) Determination of soft threshold power for SAS (E) Cluster tree of highly connected genes in key modules of OA.(F) Cluster tree of highly connected genes in key modules of SAS (G) The relationship between modules and traits of OA, Each cell contains a correlation and a p-value (H) Modular-feature relationship in SAS. Each cell contains a correlation and a p-value.
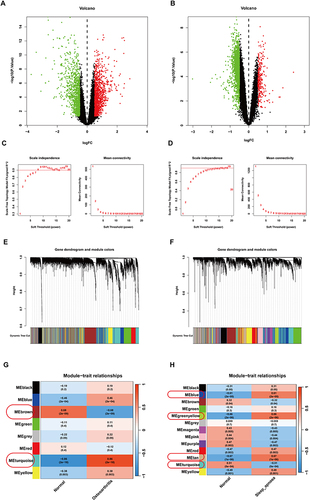
Figure 3 Analysis of shared gene enrichment and pathway MR in SAS and OA: (A) Venn diagram of SAS, OA and shared genes (B) GO enrichment analysis of shared genes. (C) KEGG enrichment analysis of shared genes. (D) Results of MR of pathways in colorectal cancer and SAS and OA.
Figure 4 Results of JUNB(A), COL8A1(B), FOSB(C), and IER2(D) colocalization analysis.
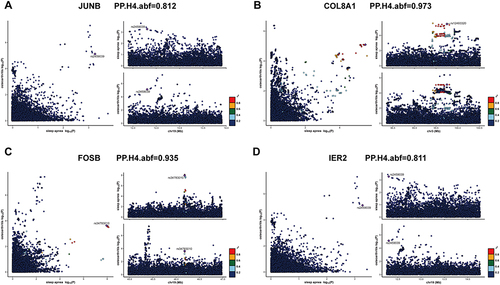
Figure 5 Violin plot of immune score (A) OA group and control group (B) early OA group and end OA group (C) SAS group and control group (D) violin plot of SAS at different stages (“**”:P<0.01, “*”: P<0.05, “ns”: P>0.05, PS: primary snoring, MSO: moderate to severe obstructive sleep apnea, VSO: very severe obstructive sleep apnea).
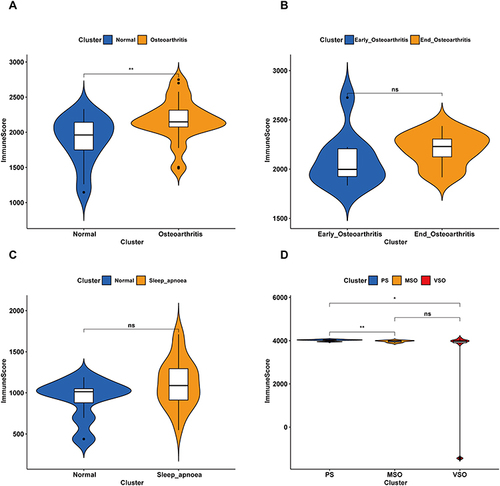
Figure 6 Results of Mendelian randomization of immune cell phenotypes and SAS and OA. (A) Venn diagram of immunophenotypes that protect against OA and immunophenotypes that protect against SAS. (B)Venn diagram of immunophenotypes that promote OA and immunophenotypes that promote SAS. (C)Forest plots of immunophenotypes that can affect both OA and SAS.