
Figures & data
Table 1 Demographic Characteristics of the Sample
Table 2 Fit Indices of the for the LPA Models (T0 to T1), for Increasing Number of Classes (1 to 5)
Figure 1 Latent profile indicator conditional means for the three‐profile solution at T0.A line chart that shows the mean scores on 8 items of bedtime procrastination for three subgroups identified by the Latent Profile Analysis (LPA) method at baseline (T0). The third subgroup has the highest mean score and is named the High Bedtime Procrastination group, the second subgroup has the next highest score and is named the Moderate Bedtime Procrastination group, and the first subgroup has the lowest mean score, named the Low Bedtime Procrastination group.
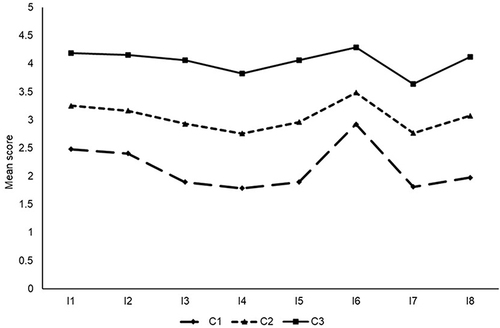
Figure 2 Latent profile indicator conditional means for the three‐profile solution at T1. A line chart that shows the mean scores on 8 items of bedtime procrastination for three subgroups identified by the Latent Profile Analysis (LPA) method at T1. The third subgroup has the highest mean score and is named the High Bedtime Procrastination group, the second subgroup has the next highest score and is named the Moderate Bedtime Procrastination group, and the first subgroup has the lowest mean score, named the Low Bedtime Procrastination group.
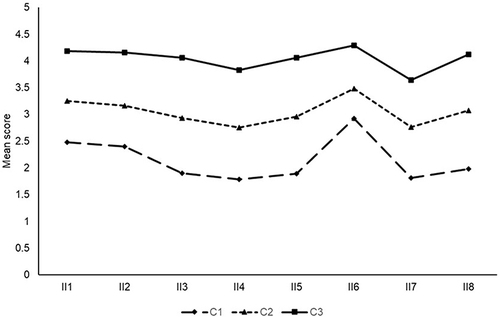
Table 3 Latent Transition Probabilities Examining Continuity and Change from T0 to T1
Table 4 Results of Multinomial Logistic Regressions on Transition Probabilities