Figures & data
Figure 1 (A–C) Flow chart of the algorithm.
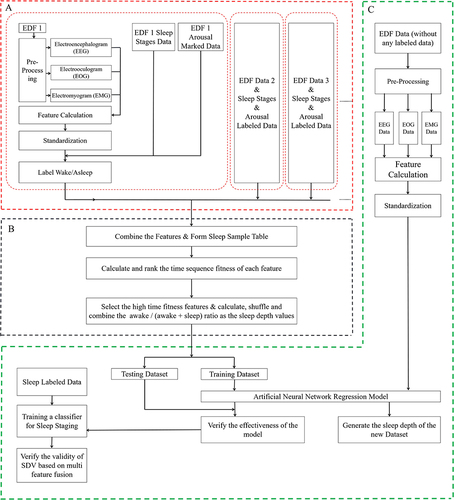
Figure 2 Multi-feature selection based on timing fitness.
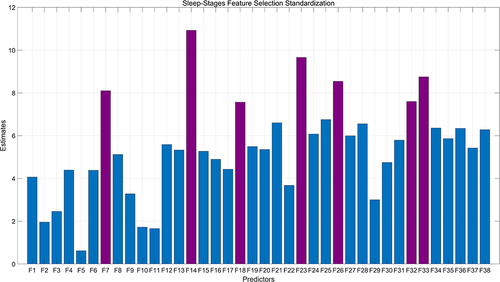
Table 1 Statistical Results of the Sleep Depth Sample Values
Figure 3 Comparison between sleep depth samples and sleep stages. (a) is the manually calibrated sleep staging map, with the horizontal axis representing time points (a point every 3 seconds), and the vertical axis representing sleep stages; (b) is the SDV sample values map for every 3 seconds.
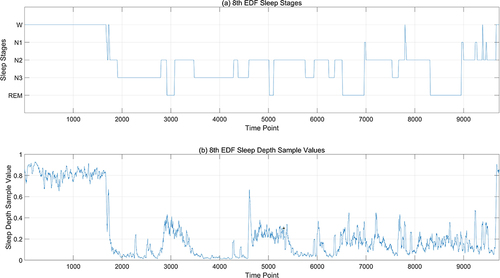
Figure 4 Statistical result of sleep depth samples.
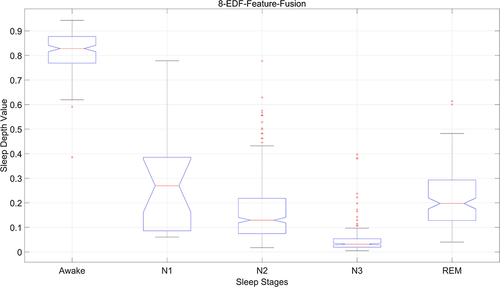
Figure 5 Error histogram of ANN model.
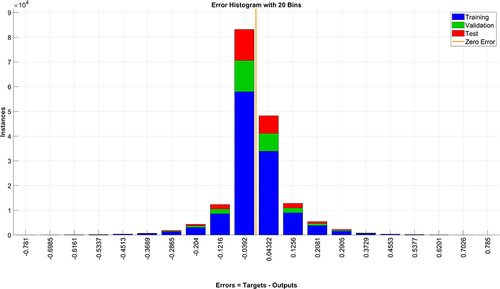
Figure 6 Prediction result of ANN model. (a) is the manually calibrated sleep staging map, with the horizontal axis representing time points (a point every 1 seconds), and the vertical axis representing sleep stages; (b) is the sleep depth values predicted by the ANN model.
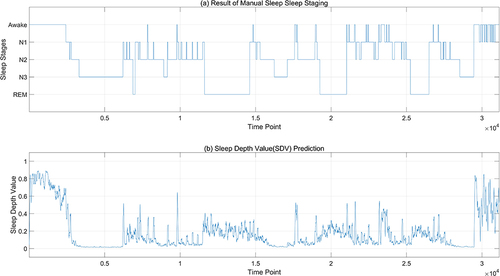
Figure 7 Details of prediction result. (a) is the details between 500–3500 seconds of manually sleep staging result; (b) is the details between 500–3500 seconds of sleep depth values predicted by the ANN model.
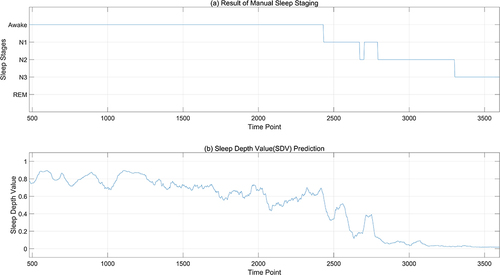
Figure 8 Sleep staging result based on SDV. (a) is the manually calibrated sleep staging map, with the horizontal axis representing time points (a point every 3 seconds), and the vertical axis representing sleep stages; (b) is the SVM-classified stages result based on 3-second epochs; (c) is the result of SVM refined by HMM model.
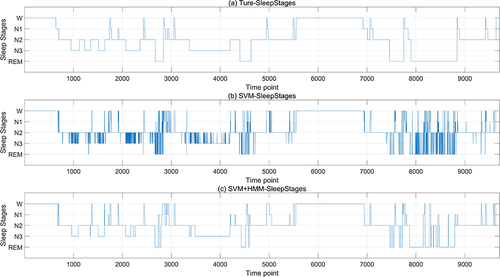
Table 2 Accuracy Results of Sleep Stage Classification
Figure 9 Statistical result of SDV in arousal period.
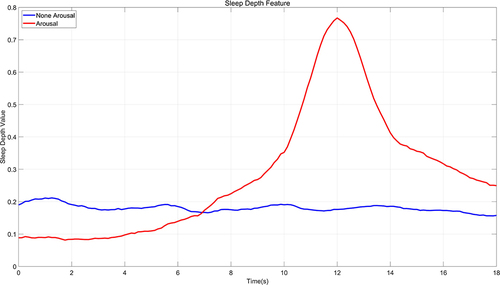
Figure 10 Arousal detection based on SDV pattern recognition.
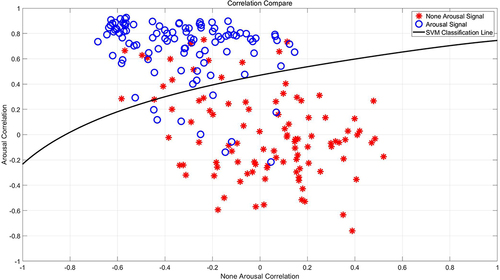
Figure 11 Comparison between two features in arousal period. (a) is the correlation between the frequency band for beta waves (feature number 23) and the arousal template; (b) is the correlation between the local entropy for theta waves (feature number 33) and the arousal template.
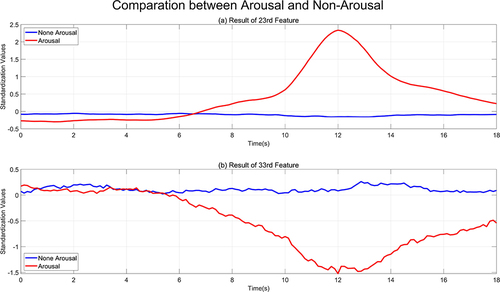
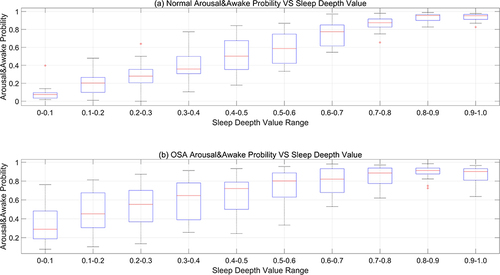
Figure 12 Arousal & awake probability between normal and OSA. (a) represents the probability of experiencing arousal during sleep for individuals with normal sleep patterns; (b) denotes the likelihood of arousal events occurring during sleep in individuals diagnosed with obstructive sleep apnea (OSA).