
Figures & data
Table 1 Demographic and socioeconomic status of respondents
Table 2 Personal lifestyle habits and sleep behavior of respondents
Figure 1 Mean nocturnal sleep duration (hours) on weekdays (left) and weekends (right) by chronotype. The weekend–weekday difference in sleep duration was significant in the E and N groups (P<0.001, Student’s t-test), but not the M group. When comparing the chronotype groups together, mean sleep duration was not significantly different between groups on weekdays, but was so on weekends (P=0.007, analysis of variance).
Note: *Significant difference in sleep duration among the chronotype groups on weekends.
Abbreviations: E, evening chronotype; N, neither type; M, morning chronotype.
Abbreviations: E, evening chronotype; N, neither type; M, morning chronotype.
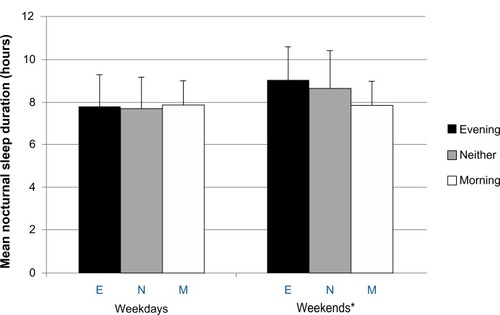
Table 3 Variation of respondent sleep–wake habits and duration between weekdays and weekends with respect to circadian typology