Figures & data
Figure 1 Overall study patient disposition.
Notes: The study comprised of 2 weeks placebo run-in period followed by randomization 1:1 to receive PRM (Circadin® 2 mg) or placebo for 6 weeks followed by a 2-week washout period.
Abbreviations: FAS, full analysis set; PRM, prolonged-release melatonin.
Abbreviations: FAS, full analysis set; PRM, prolonged-release melatonin.
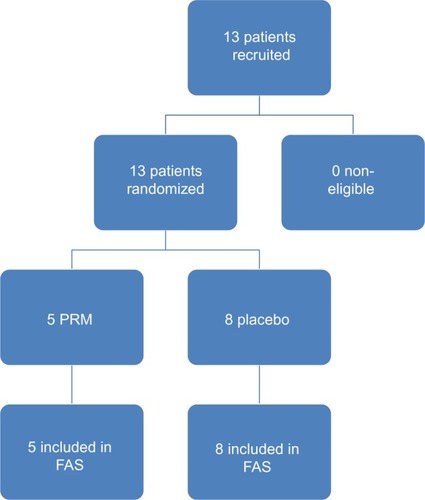
Table 1 Demographics and caffeine/alcohol history for safety population
Figure 2 Endpoint of sleep variables: sleep duration.
Notes: (A) Change from baseline for the total night sleep duration (± SEM). Treatment period took place from weeks 3–8; WO period from weeks 9–10. (B) Individual changes from baseline to end of treatment in total nighttime sleep duration for the PRM and placebo groups.
Abbreviations: PRM, prolonged-release melatonin; SEM, standard error of the mean; WO, washout.
Abbreviations: PRM, prolonged-release melatonin; SEM, standard error of the mean; WO, washout.
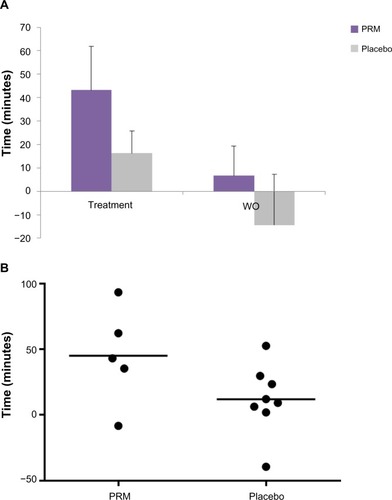
Figure 3 Endpoint of sleep variables: sleep latency and daytime naps.
Notes: (A) Change from baseline for night sleep latency (± SEM) (B) Change from baseline for the total duration of naps (± SEM). Treatment period is calculated as weeks 3–8; WO period is calculated as weeks 9–10.
Abbreviations: PRM, prolonged-release melatonin; SEM, standard error of the mean; WO, washout.
Abbreviations: PRM, prolonged-release melatonin; SEM, standard error of the mean; WO, washout.
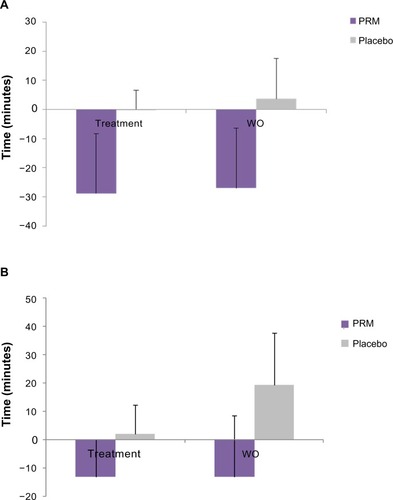
Figure 4 Onset and offset of treatment effects on sleep.
Notes: Analysis week-by-week (mean ± SEM) in (A) total night sleep duration and (B) sleep latency. BL period is from weeks 1–2; treatment period is from weeks 3–8; WO period is from weeks 9–10.
Abbreviations: PRM, prolonged-release melatonin; BL, baseline; SEM, standard error of the mean; WO, washout.
Abbreviations: PRM, prolonged-release melatonin; BL, baseline; SEM, standard error of the mean; WO, washout.
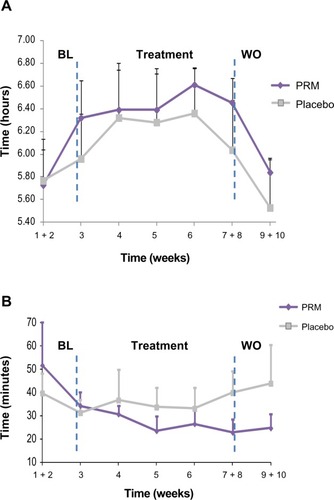
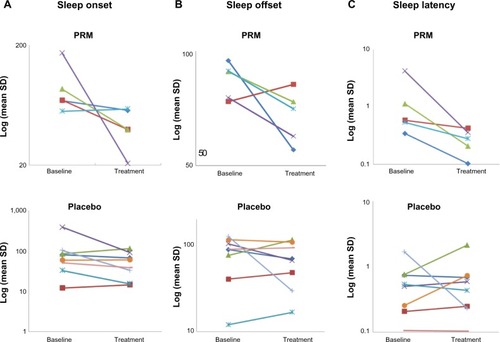
Figure 5 Mean SD of the individual changes in sleep onset/offset and latency variability during baseline and the last 2 weeks of PRM and placebo treatment.
Notes: Data from all individual patients in the study in the PRM (top panels) and placebo (bottom panels) treatment are depicted using logarithmic scales. The different colored lines in the figure represent different patients.
Abbreviations: PRM, prolonged-release melatonin; SD, standard deviation.
Abbreviations: PRM, prolonged-release melatonin; SD, standard deviation.